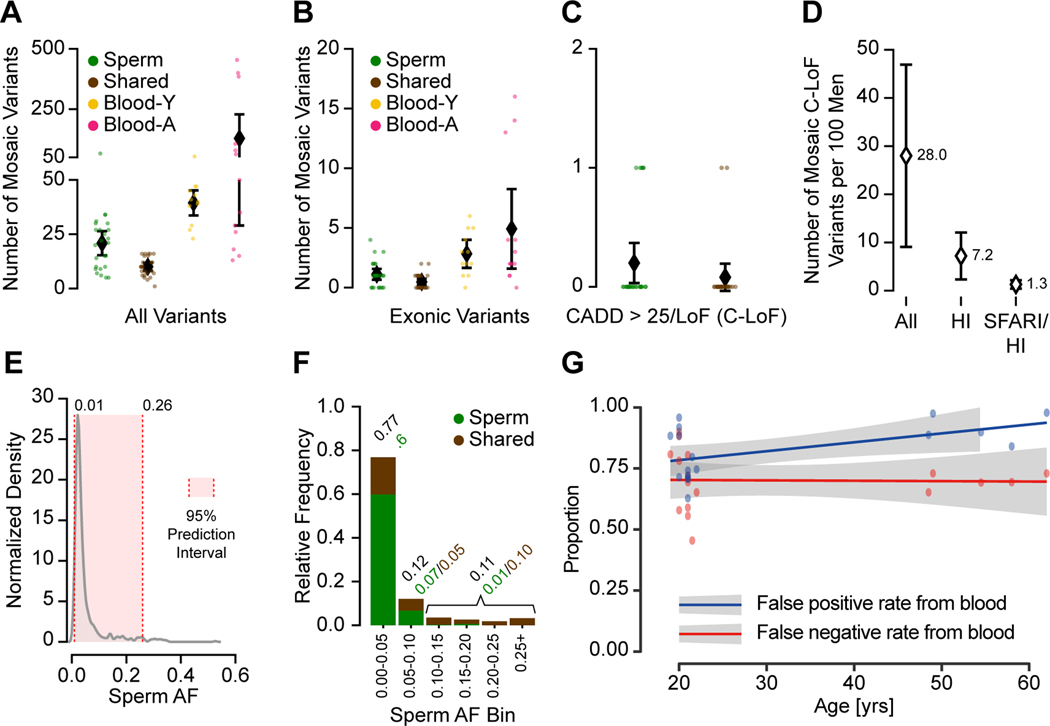
Figure 5. Clonal sperm mosaicism represents a life-long transmission risk with 1 in 15 males carrying a predicted high-impact pathogenic mutation.
(A) Number of detectable mosaic variants in each category from 2909 total variants; shown are numbers of variants from each individual and the population mean with the 95% CI.
(B) Number of detectable mosaic variants in each category for exonic variants. Shown are individual data points and mean with a 95% confidence interval.
(C) Number of Sperm and Shared variants with a CADD score >25 or a loss-of-function prediction (C-LoF); shown are numbers of variants from each individual and the population mean with the 95% CI.
(D) Estimated number of males per 100 (with 95% CI) with a detectable C-LoF variant in any gene (All), a haploinsufficient (HI) gene, or in a HI gene in the SFARI gene list (SFARI/HI).
(E) Kernel density estimation of the AF distribution of all sperm mosaic variants. The 95% prediction interval for AF is 1–26%.
(F) Stacked bar charts show the relative frequency of AF categories, binned at 5% increments or above 25% for Sperm and Shared variants. The majority of mutations were <5% AF, and most of these were not shared with blood.
(G) Scatter plot and regression lines show the inaccuracy of transmissible mosaicism detection from blood increases with age (YA and AA cohort). Based on the number of blood detectable mosaic variants and their presence in sperm, blood-only detection produces a high false-positive rate that further increases with age due to CH (blue). Blood-only detection produces a consistent 66% false-negative rate (red) for the prediction of transmission across different age groups.
See also Data S3.

