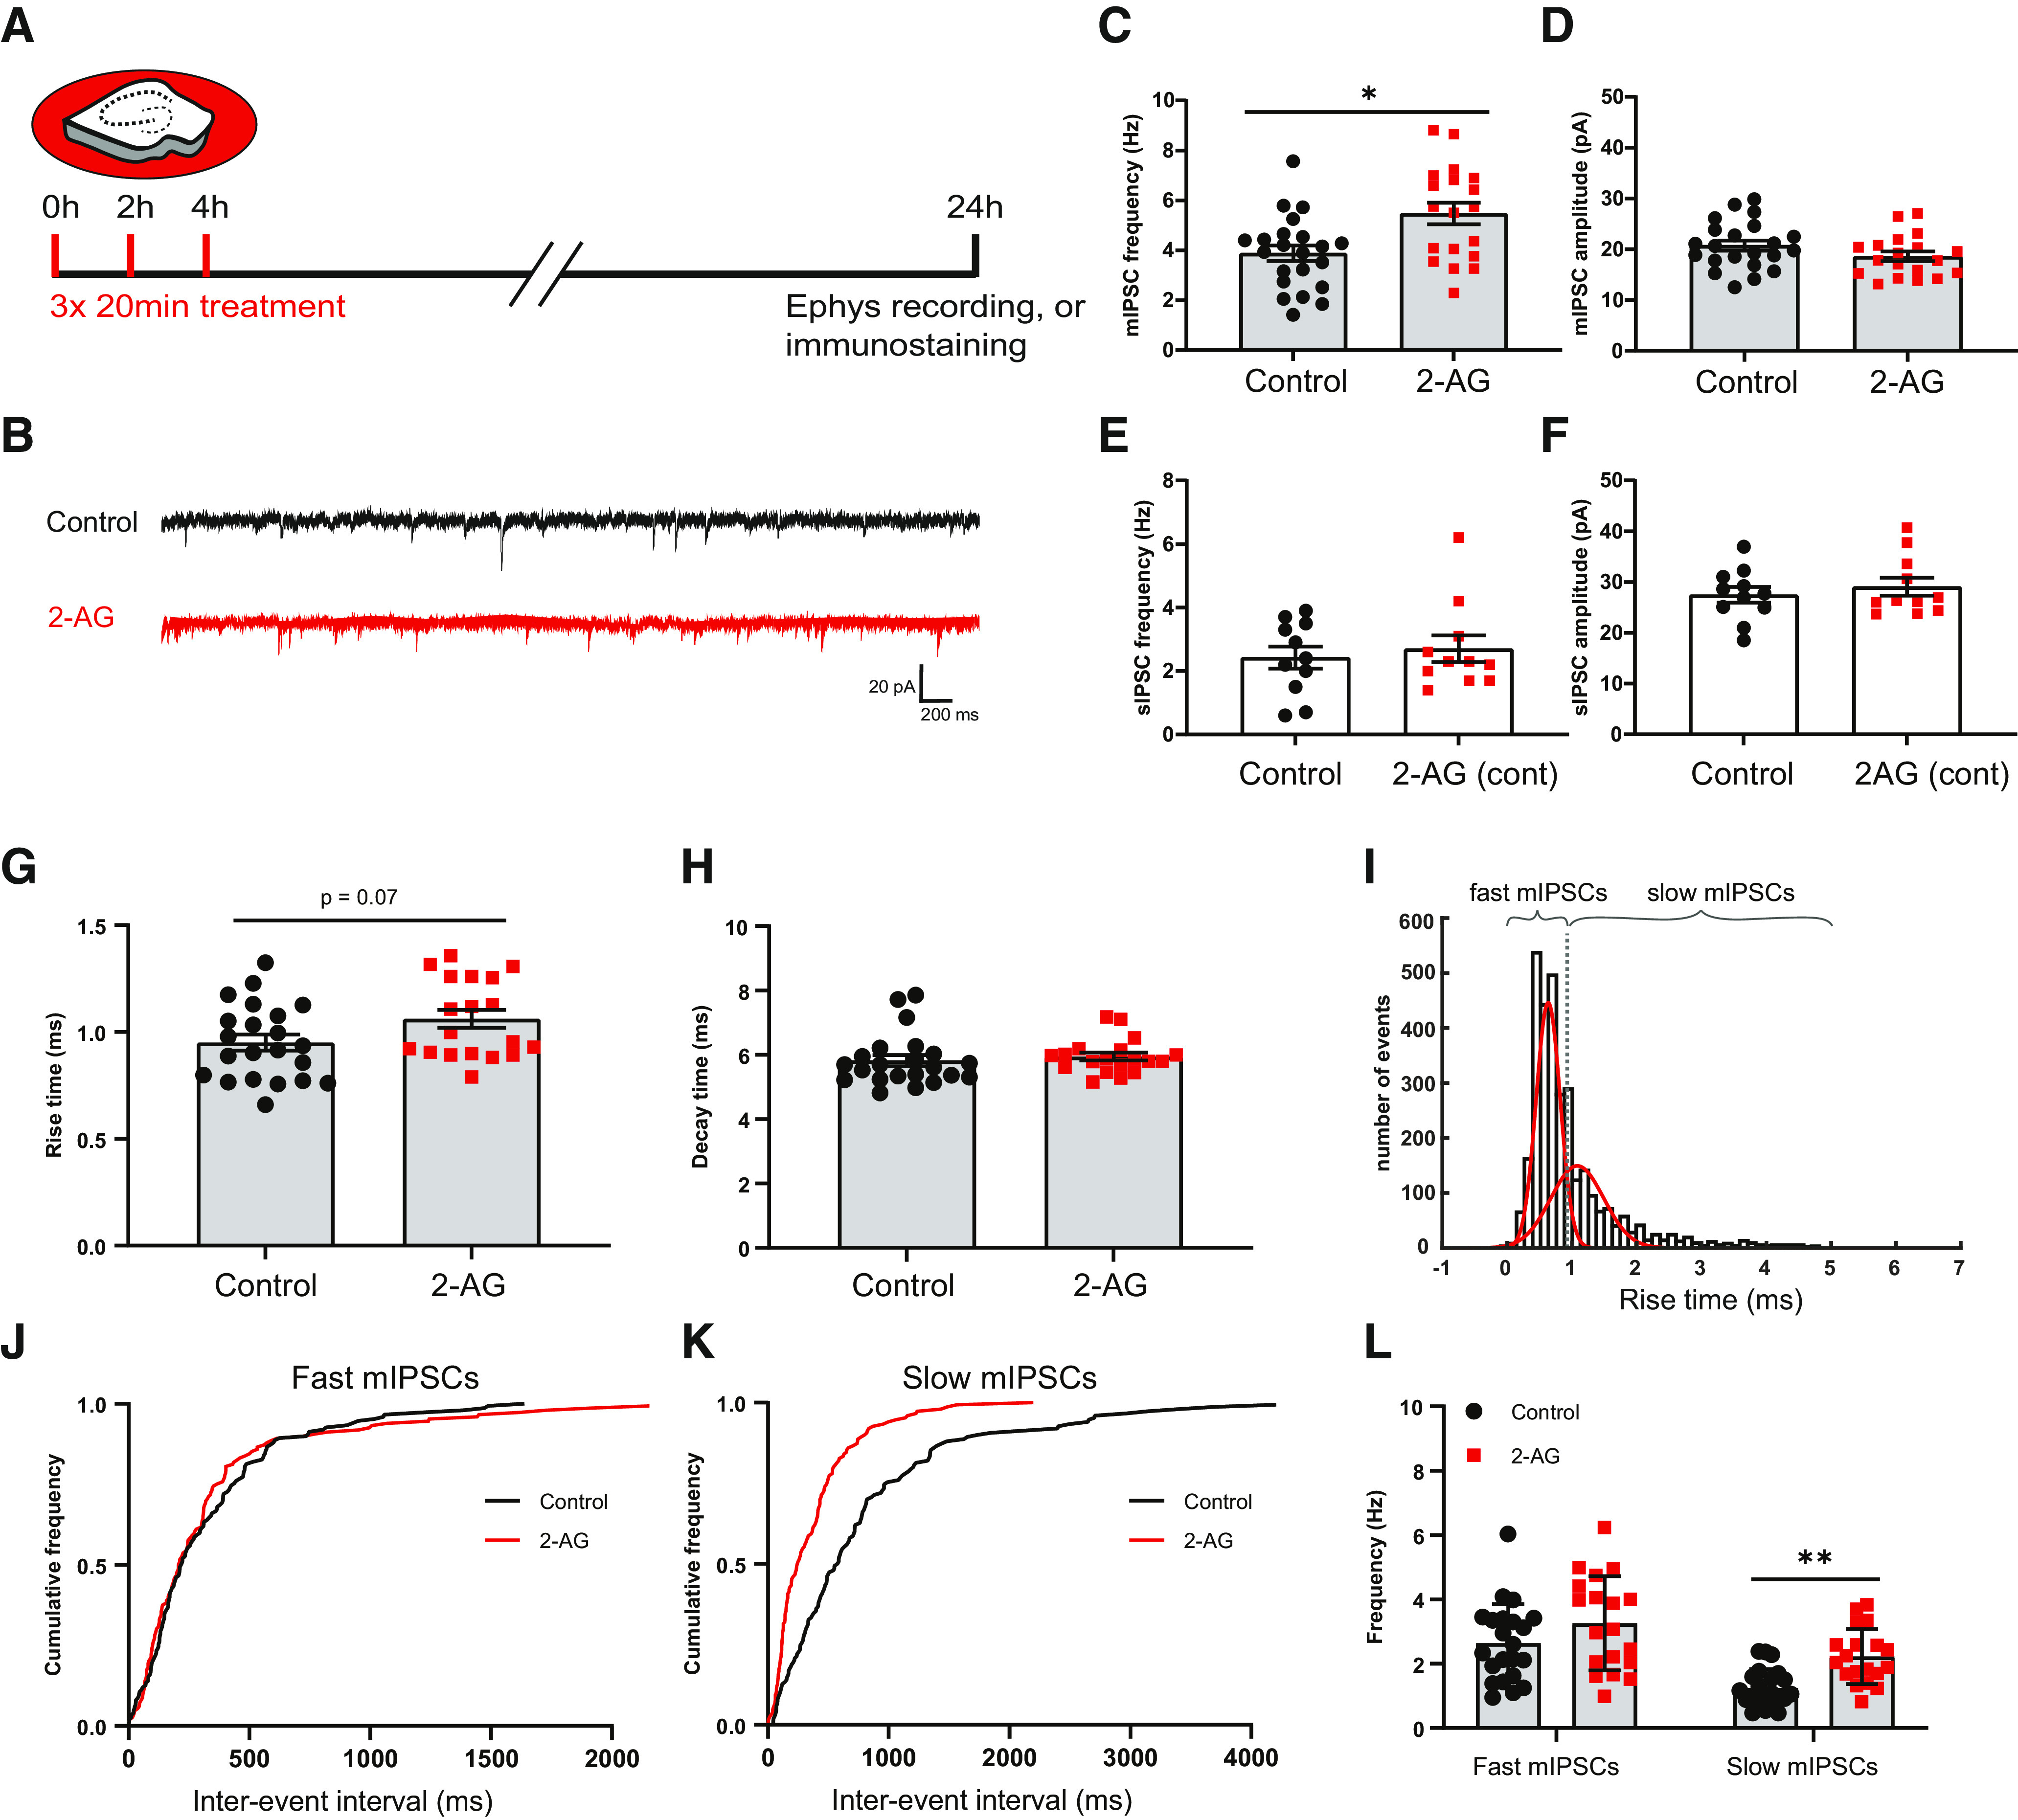
Figure 1.

Repeated CB1 receptor activation results in increased mIPSC frequency. A, Organotypic hippocampal cultures were treated three times with culturing medium containing 100 μm 2-AG or DMSO (control) for 20 min with 2 h intervals. After 24 h, slices were used for electrophysiology and immunostaining experiments. B, Example traces of mIPSC recordings from control (black) and 2-AG-treated slice (red). C, D, Mean frequency (C) and amplitude (D) of mIPSCs in control and 2-AG-treated slices (MW test: p = 0.013 in C; p = 0.16 in D). Data from 22 cells in six control slices and 19 cells in six 2-AG-treated slices. E, F, Mean frequency (E) and amplitude (F) of sIPSCs (spontaneous IPSCs) in control and 2-AG-treated slices, when 2-AG was continuously present for 24 h (MW test: p = 0.99 in E; and p = 0.95 in F). Data from 11 cells in five control slices and 11 cells in six 2-AG-treated slices. G, Mean rise time of mIPSCs in control and 2-AG-treated slices (MW, p = 0.073). H, Mean of mIPSC decay time in control and 2-AG-treated slices (MW test, p = 0.19). I, The distribution of the rise times of mIPSCs was fitted with a double Gaussian to separate fast and slow mIPSCs. J, K, Cumulative distribution of interevent intervals of mIPSCs with fast (J) and slow (K) rise times (KS test: p = 0.65 in J; p < 0.0001 in K). L, Mean frequency of mIPSCs with fast and slow rise times (two-way ANOVA Sidak test: fast, p = 0.14; slow, p = 0.0095). Data in G–L, C, and D are from the same dataset. Asterisks indicate significant differences (*p < 0.05; **p < 0.01).
