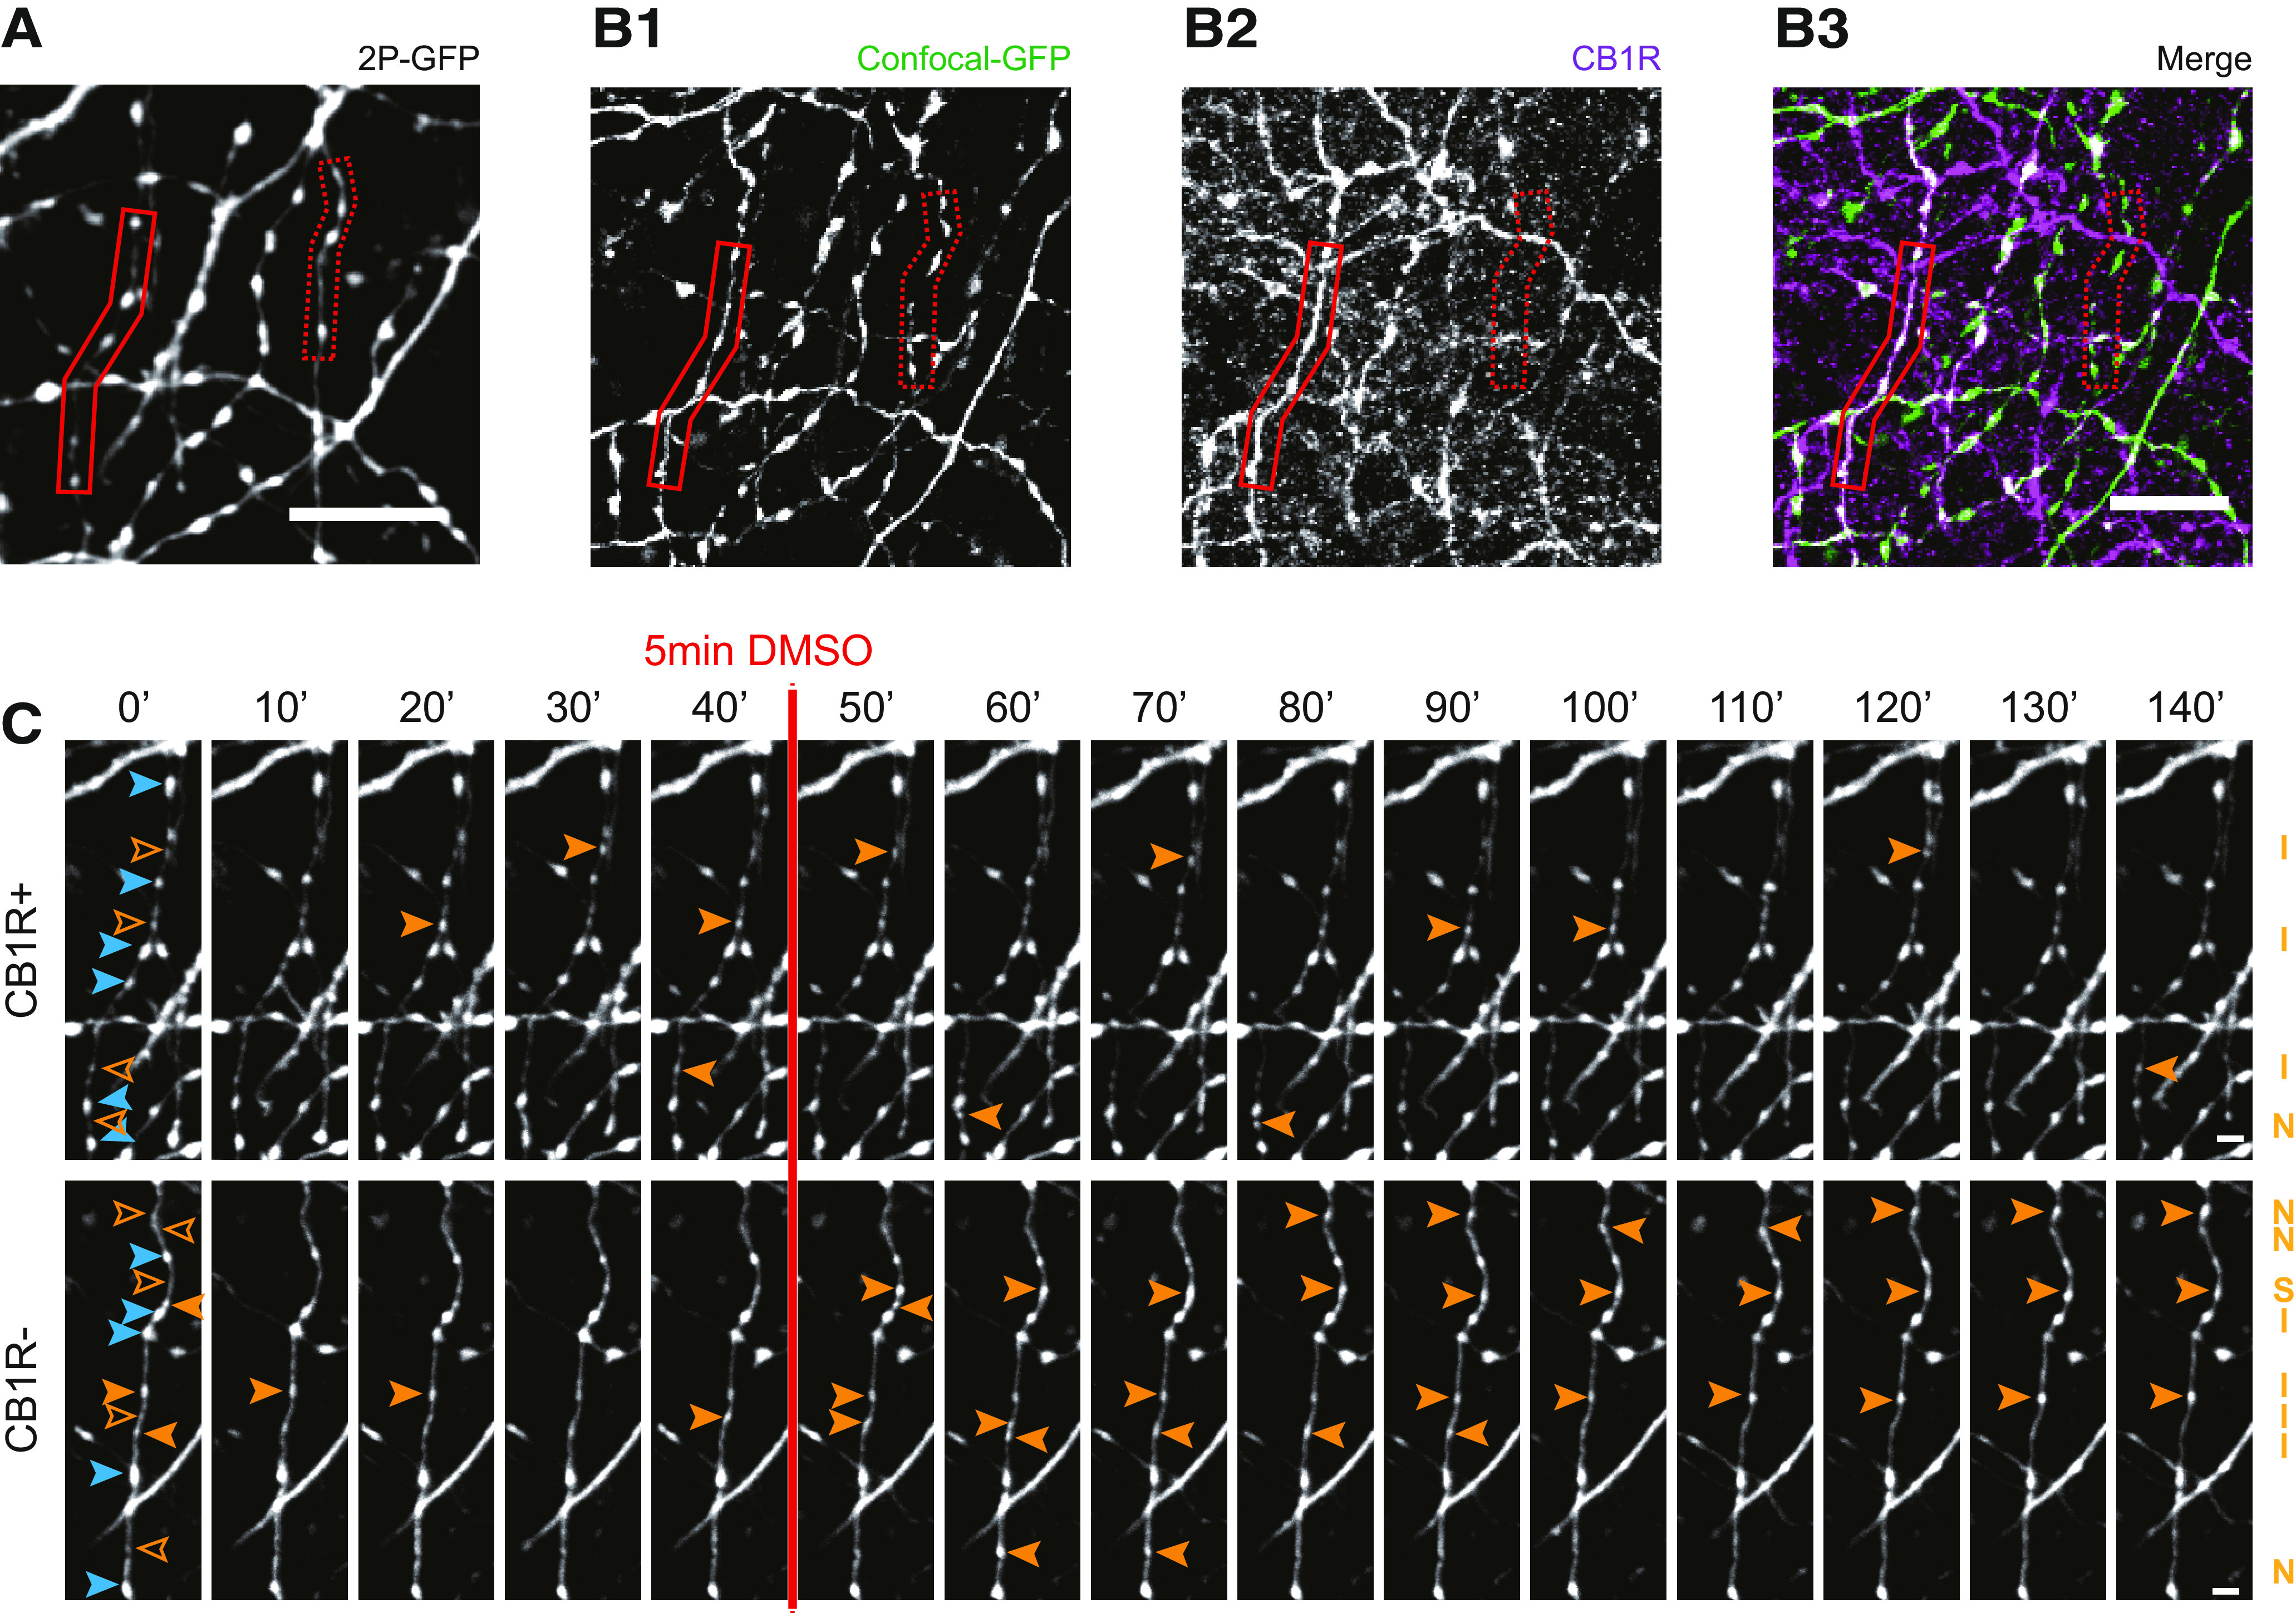
Figure 4.

Distinction between CB1R+ and CB1R– axons using post hoc immunohistochemistry. A, z-Projection of representative two-photon image of GFP-labeled inhibitory axons. After two-photon live imaging, the slice was immediately fixated and further processed for immunohistochemistry to assess CB1R expression. B1, Confocal images of the same area after post hoc immunohistochemistry, showing the same GFP-labeled axons as in A (indicated with solid and dashed red boxes). B2, Immunostaining against CB1 receptors show a clear distinction between CB1R+ axons (solid red box), which express CB1 receptors and cover the entire axonal surface, and CB1R– axons (dashed red box), which do not express CB1 receptors. B3, merged image of B1 and B2. C, Two-photon time-lapse imaging of bouton dynamics in the CB1R+ and CB1R– axons indicated in A and B. Arrowheads indicate P (blue) and NP (orange) boutons, as in Figure 3A. Scale bars: A–B3, 10 µm; C, 2 μm.
