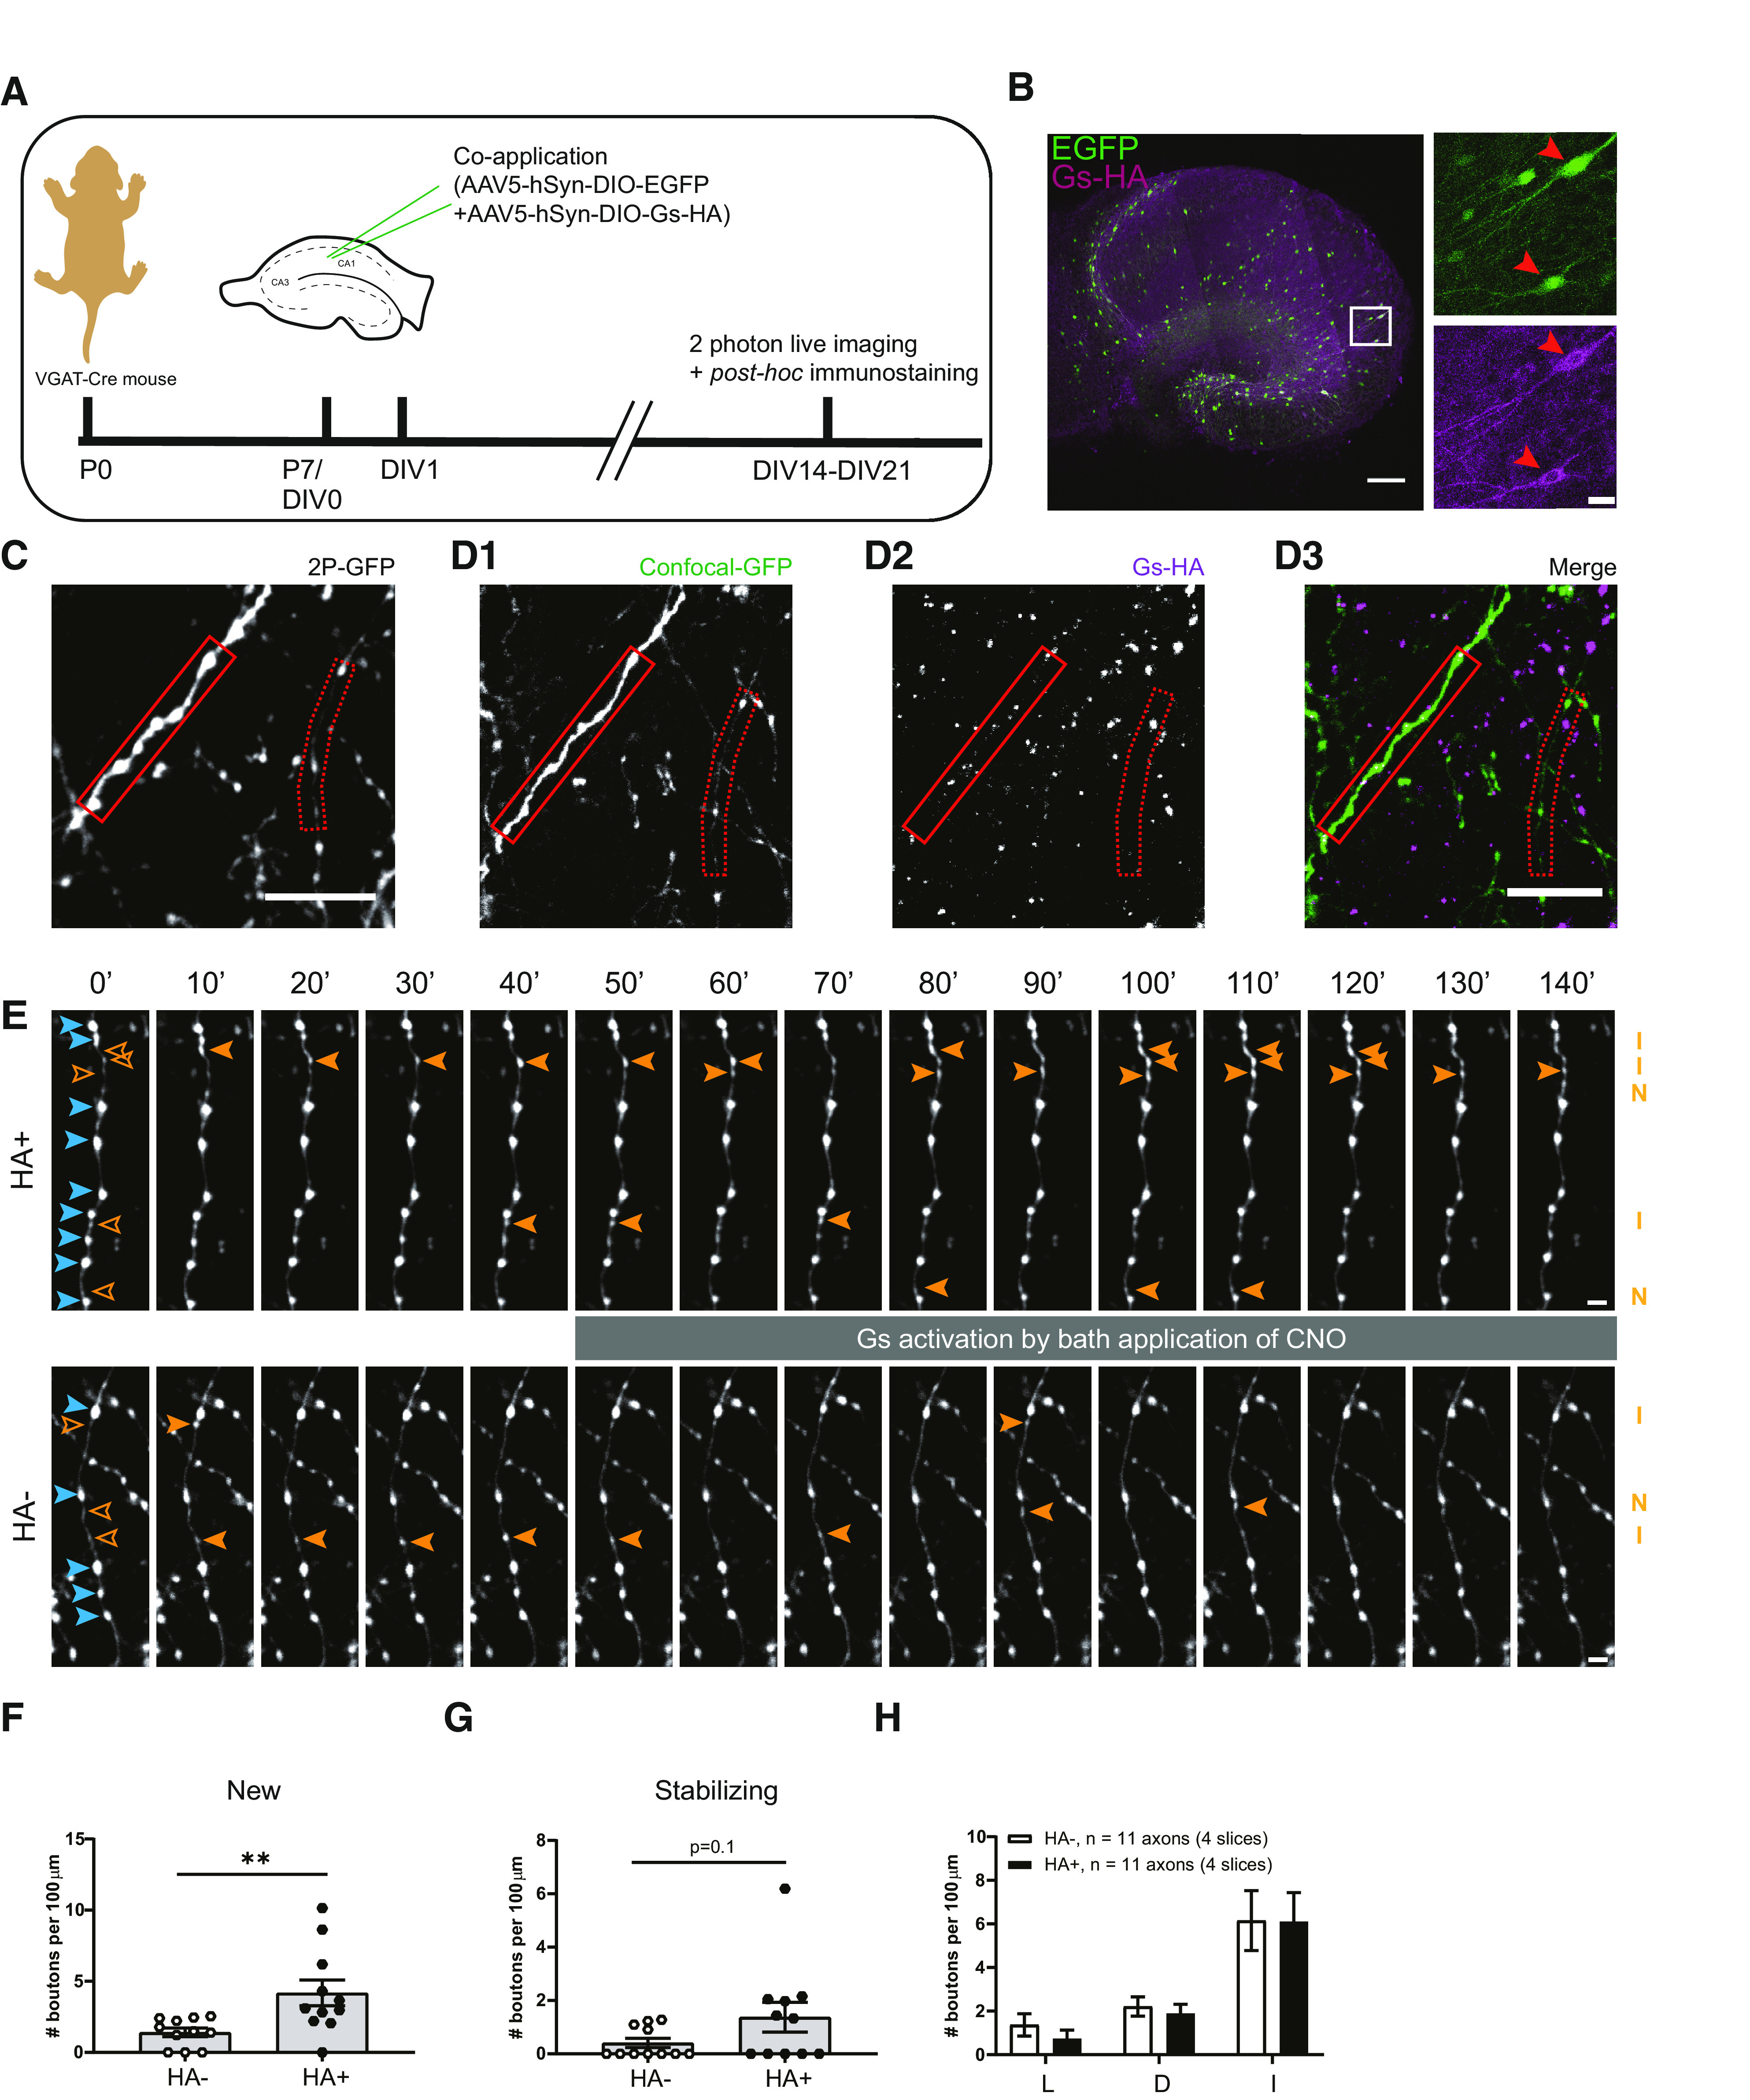
Figure 9.

Specific activation of Gs at inhibitory axons induces new bouton formation. A, Experimental design. Hippocampal slice cultures are prepared from postnatal day 7 VGAT-Cre mouse pups. At DIV1, AAV5-hSyn-DIO-EGFP and AAV5-hSyn-DIO-Gs-HA viruses are applied to the VGAT-Cre slice cultures. After 2–3 weeks (DIV14–21) slices were used for two-photon live imaging and post hoc immunostaining to reveal Gs-HA expression. B, Representative example of VGAT-Cre slice culture at DIV20 showing sparse expression of GFP and Gs-HA in GABAergic cells. Right images (zoom from white box) show Gs-HA and EGFP coexpression in a subset of neurons (red arrowheads). C, The z-projection of representative two-photon image of GFP-labeled inhibitory axons in VGAT-Cre slice. D, Confocal images of the same area in C after post hoc immunohistochemistry against HA, showing the same GFP-labeled axons as in A (solid and dashed red boxes indicate HA+ and HA– axons, respectively). E, Two-photon time-lapse imaging of bouton dynamics in the HA+ and HA– axons indicated in C and D. Gs-DREADDs were activated by bath application of 10 μm CNO after the 40 min baseline period. Arrowheads indicate P (blue) and NP (orange) boutons, as in Figure 3A. F, Mean density of new boutons at HA+ and HA– axons in response to Gs-DREADD activation (MW test, p = 0.003). G, Mean density of stabilizing boutons at HA+ and HA– axons in response to Gs-DREADD activation (MW test, p = 0.10). H, Mean density of other subgroup of NP boutons at HA+ and HA– axons in response to Gs-DREADD activation. L, Lost boutons (MW test, p = 0.30); D, destabilizing boutons (MW test, p = 0.44); I, intermittent boutons (MW test, p = 0.85). Data from 11 HA+ and 11 HA– axons in four slices. Scale bars: B, overview, 200 μm; zoom, 20 μm; C, D, 10 μm; E, 2 μm.
