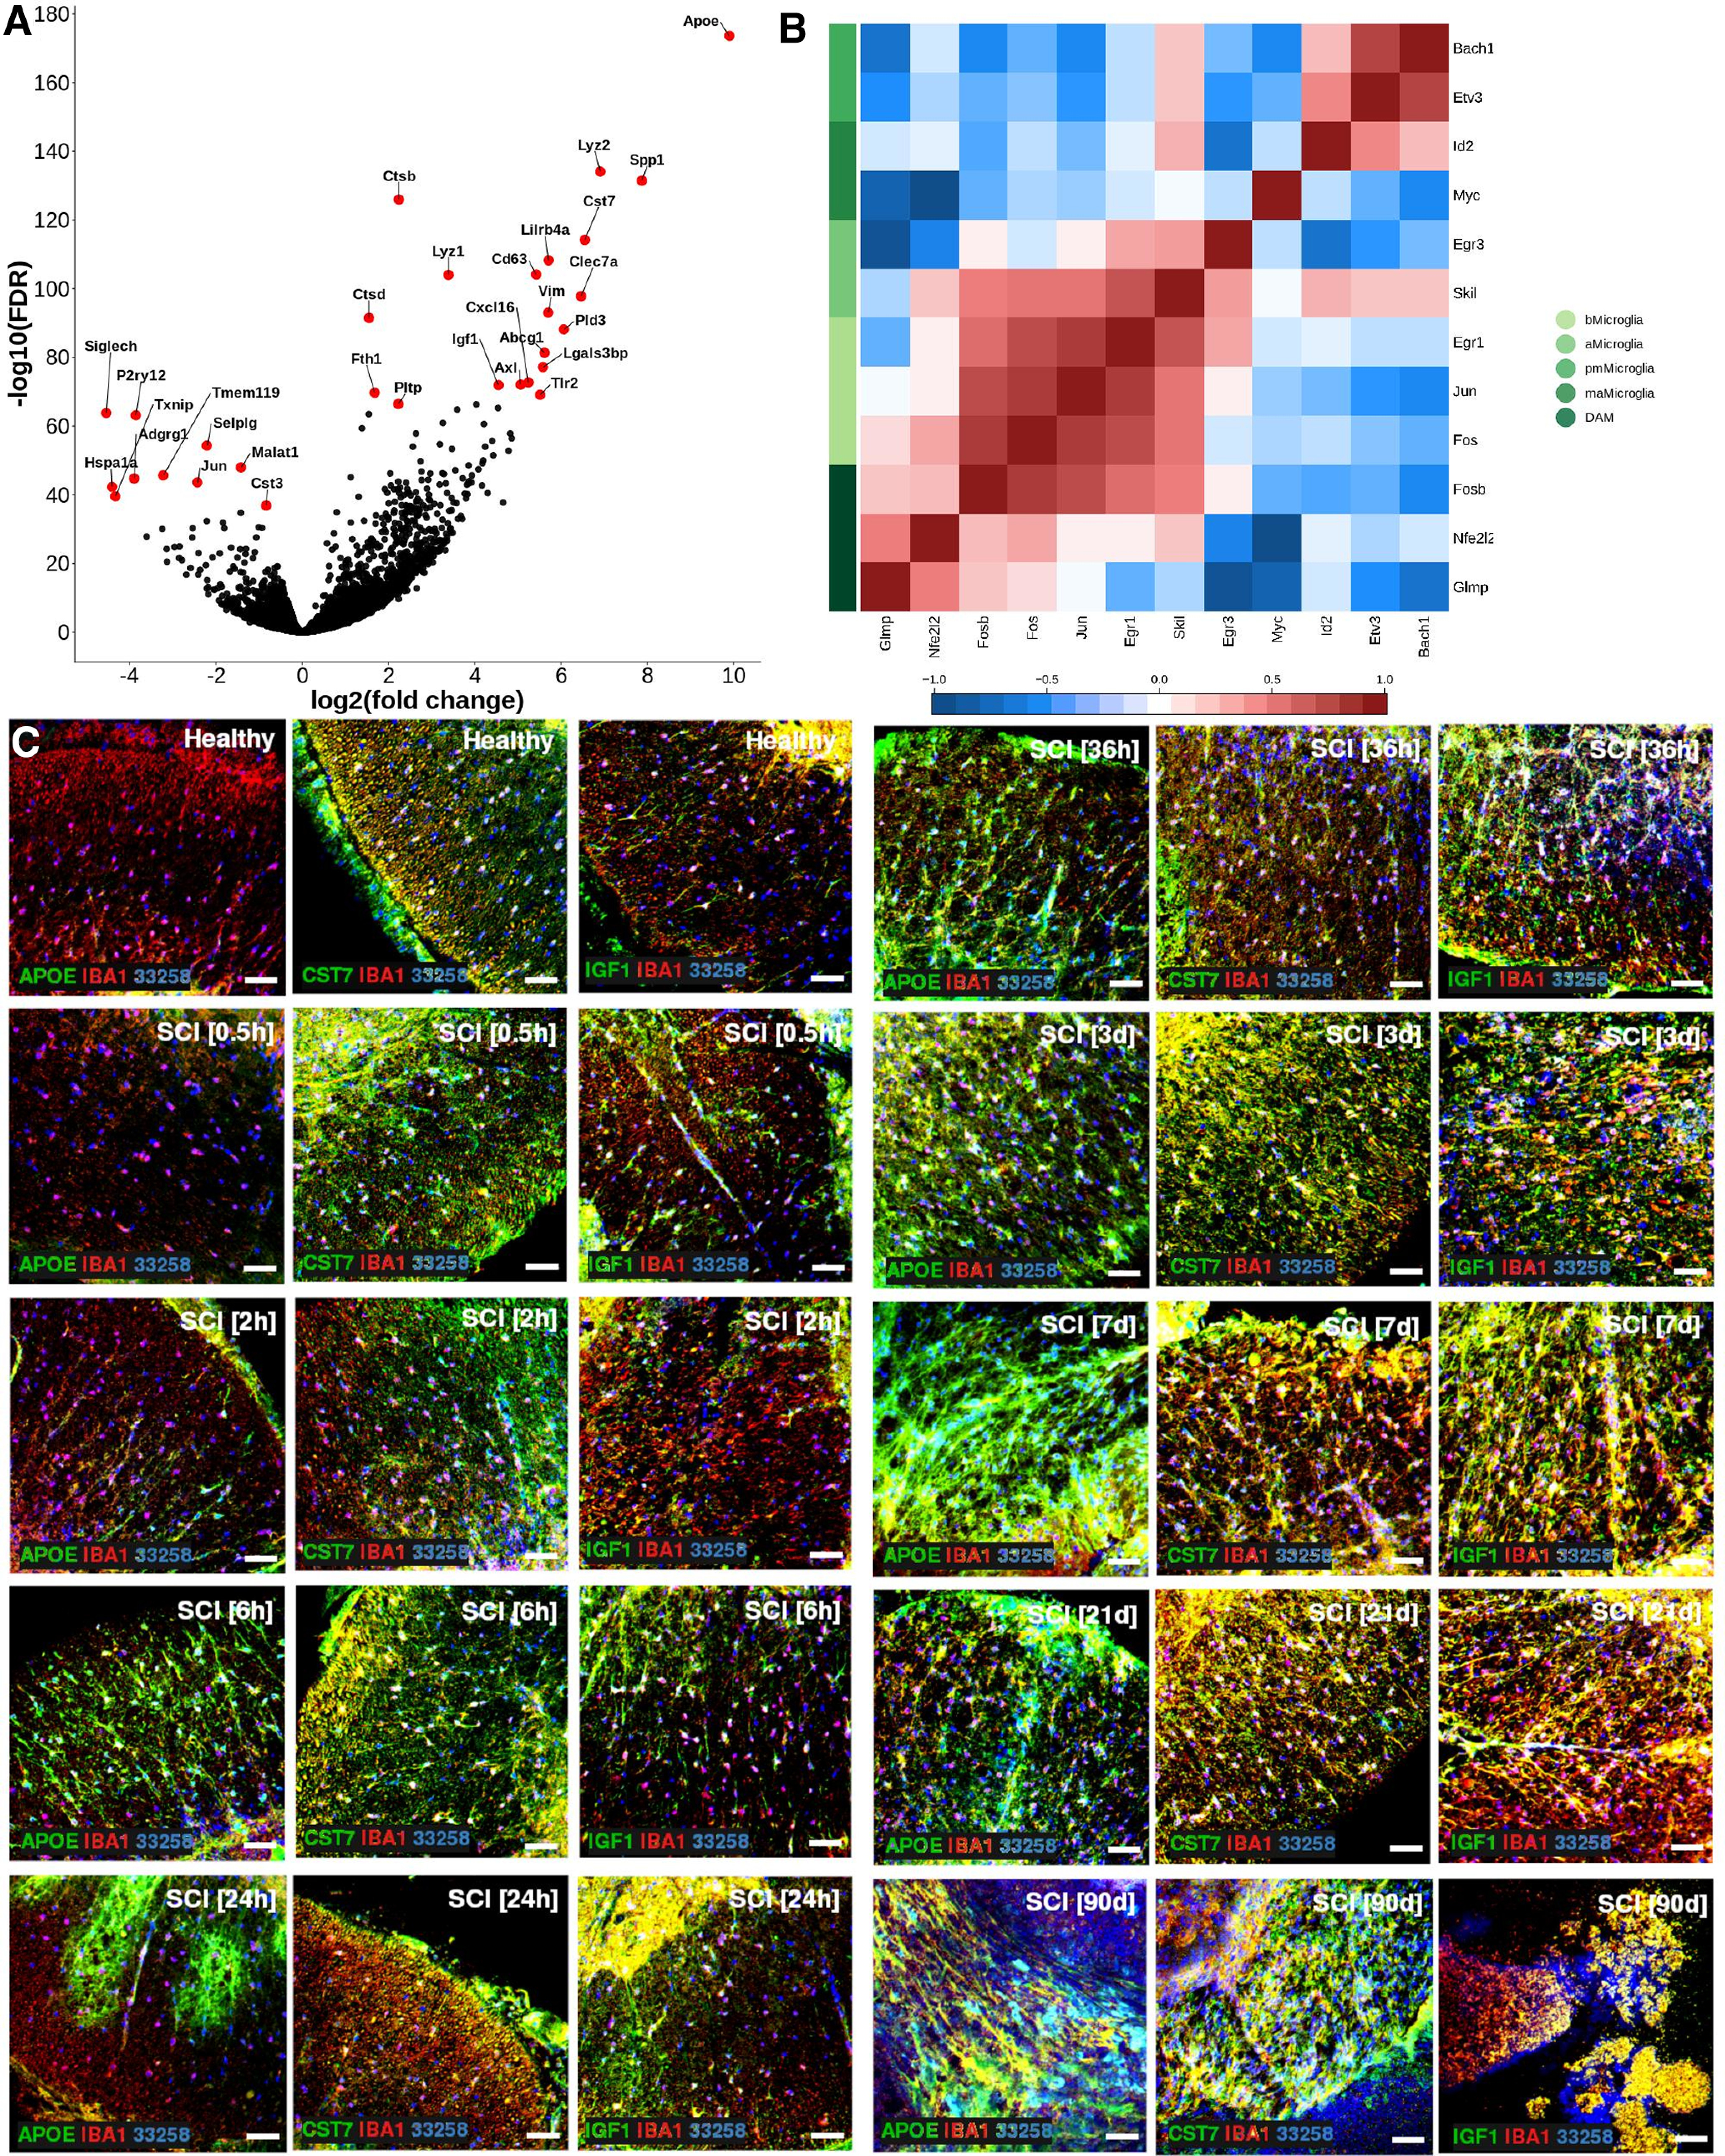
Figure 2.

A, Volcano plot depicting differentially expressed genes between DAM in SCI and baseline microglia. Top 15 significantly upregulated genes and top 10 significantly downregulated genes are indicated in red and with gene symbol. B, Correlogram of top (maximum 3) unique transcription factors for each microglial cell type. Cell type is indicated using color. Lower color key indicates the direction and size of the correlation. bMicroglia: baseline microglia; aMicroglia: activated microglia; pmMicroglia: proliferation-mediating microglia; maMicroglia: monocyte-activating microglia; DAM: disease-associated microglia in SCI; elMicroglia: embryonic-like microglia. C, Protein expression for APOE, CST7, and IGF1 on mouse spinal cord sections. Sections are taken just rostral to SCI epicenter. Scale bars: 50 µm.
