
Figure 8.
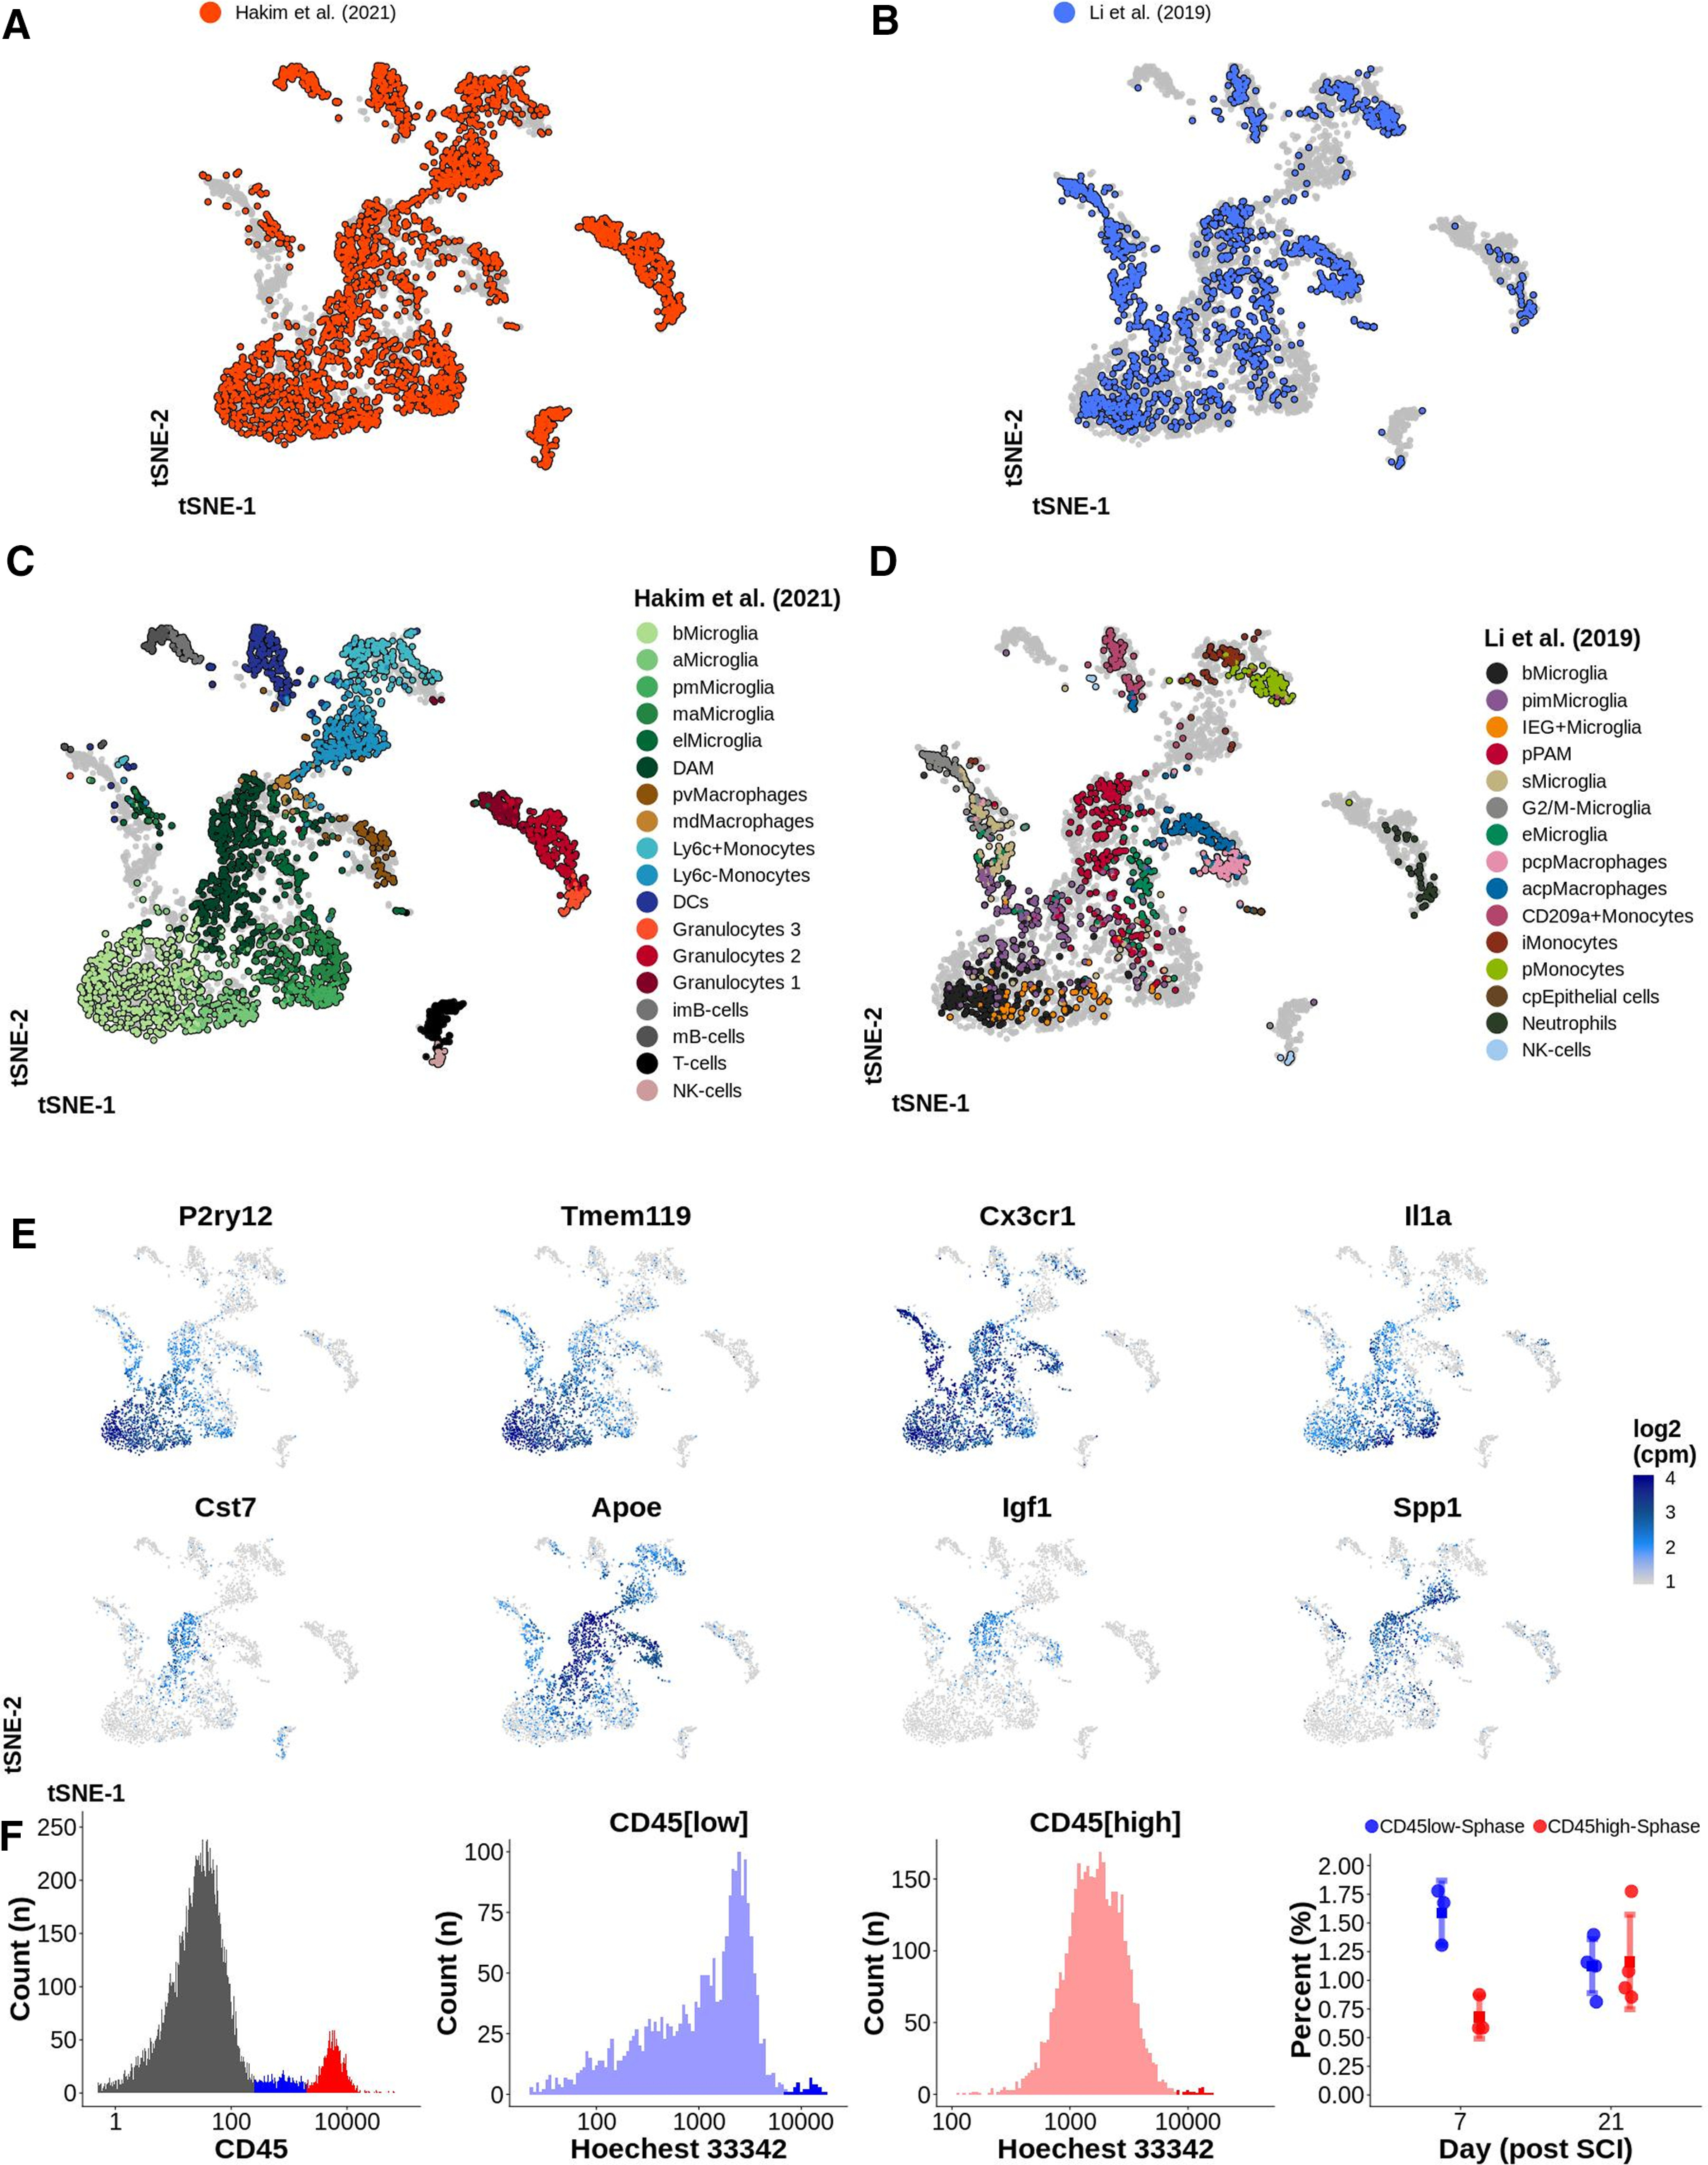
A, B, tSNE plot of 4659 CD45+ immune cells from the CNS. Data from this study is integrated with data from Li et al. (2019; Table 6). C, D, Each dataset represented by one tSNE. Cells are annotated using color representing their cell type. bMicroglia: baseline microglia; aMicroglia: activated microglia; pmMicroglia: proliferation-mediating microglia; maMicroglia: monocyte-activating microglia; DAM: disease-associated microglia in SCI; elMicroglia: embryonic-like microglia; pvMacrophages: perivascular macrophages; mdMacrophages: monocyte-derived macrophages; DCs: dendritic cells; imB-cells: immature B-cells; mB-cells: mature B-cells; pimMicroglia: postnatal immature microglia; IEG+Microglia: immediate early genes microglia; sMicroglia: s-phase microglia; pPAM: postnatal proliferative-region-associated microglia; eMicroglia: embryonic microglia; pcpMacrophages: postnatal choroid plexus macrophages; acpMacrophages: adult choroid plexus macrophages; iMonocytes: inflammatory monocytes; pMonocytes: patrolling monocytes; cpEpithelial cells: choroid plexus epithelial cells. E, tSNE plots of 4659 CD45+ immune cells for selected genes indicating the log2(cpm) expression with a continuous color for each cell separately. F, Proliferation rate of CD45low and CD45high cells at 7 and 21 d post-SCI. Hoechst 33342 expression presented on a log-scale was used for defining cells in S-phase. Right most plot reports the percentage of cells in S-phase. Each dot represents one biological replicate (four mice per time point). Mean is surrounded by a 95% CI. This figure is extended in Extended Data Figure 8-1.