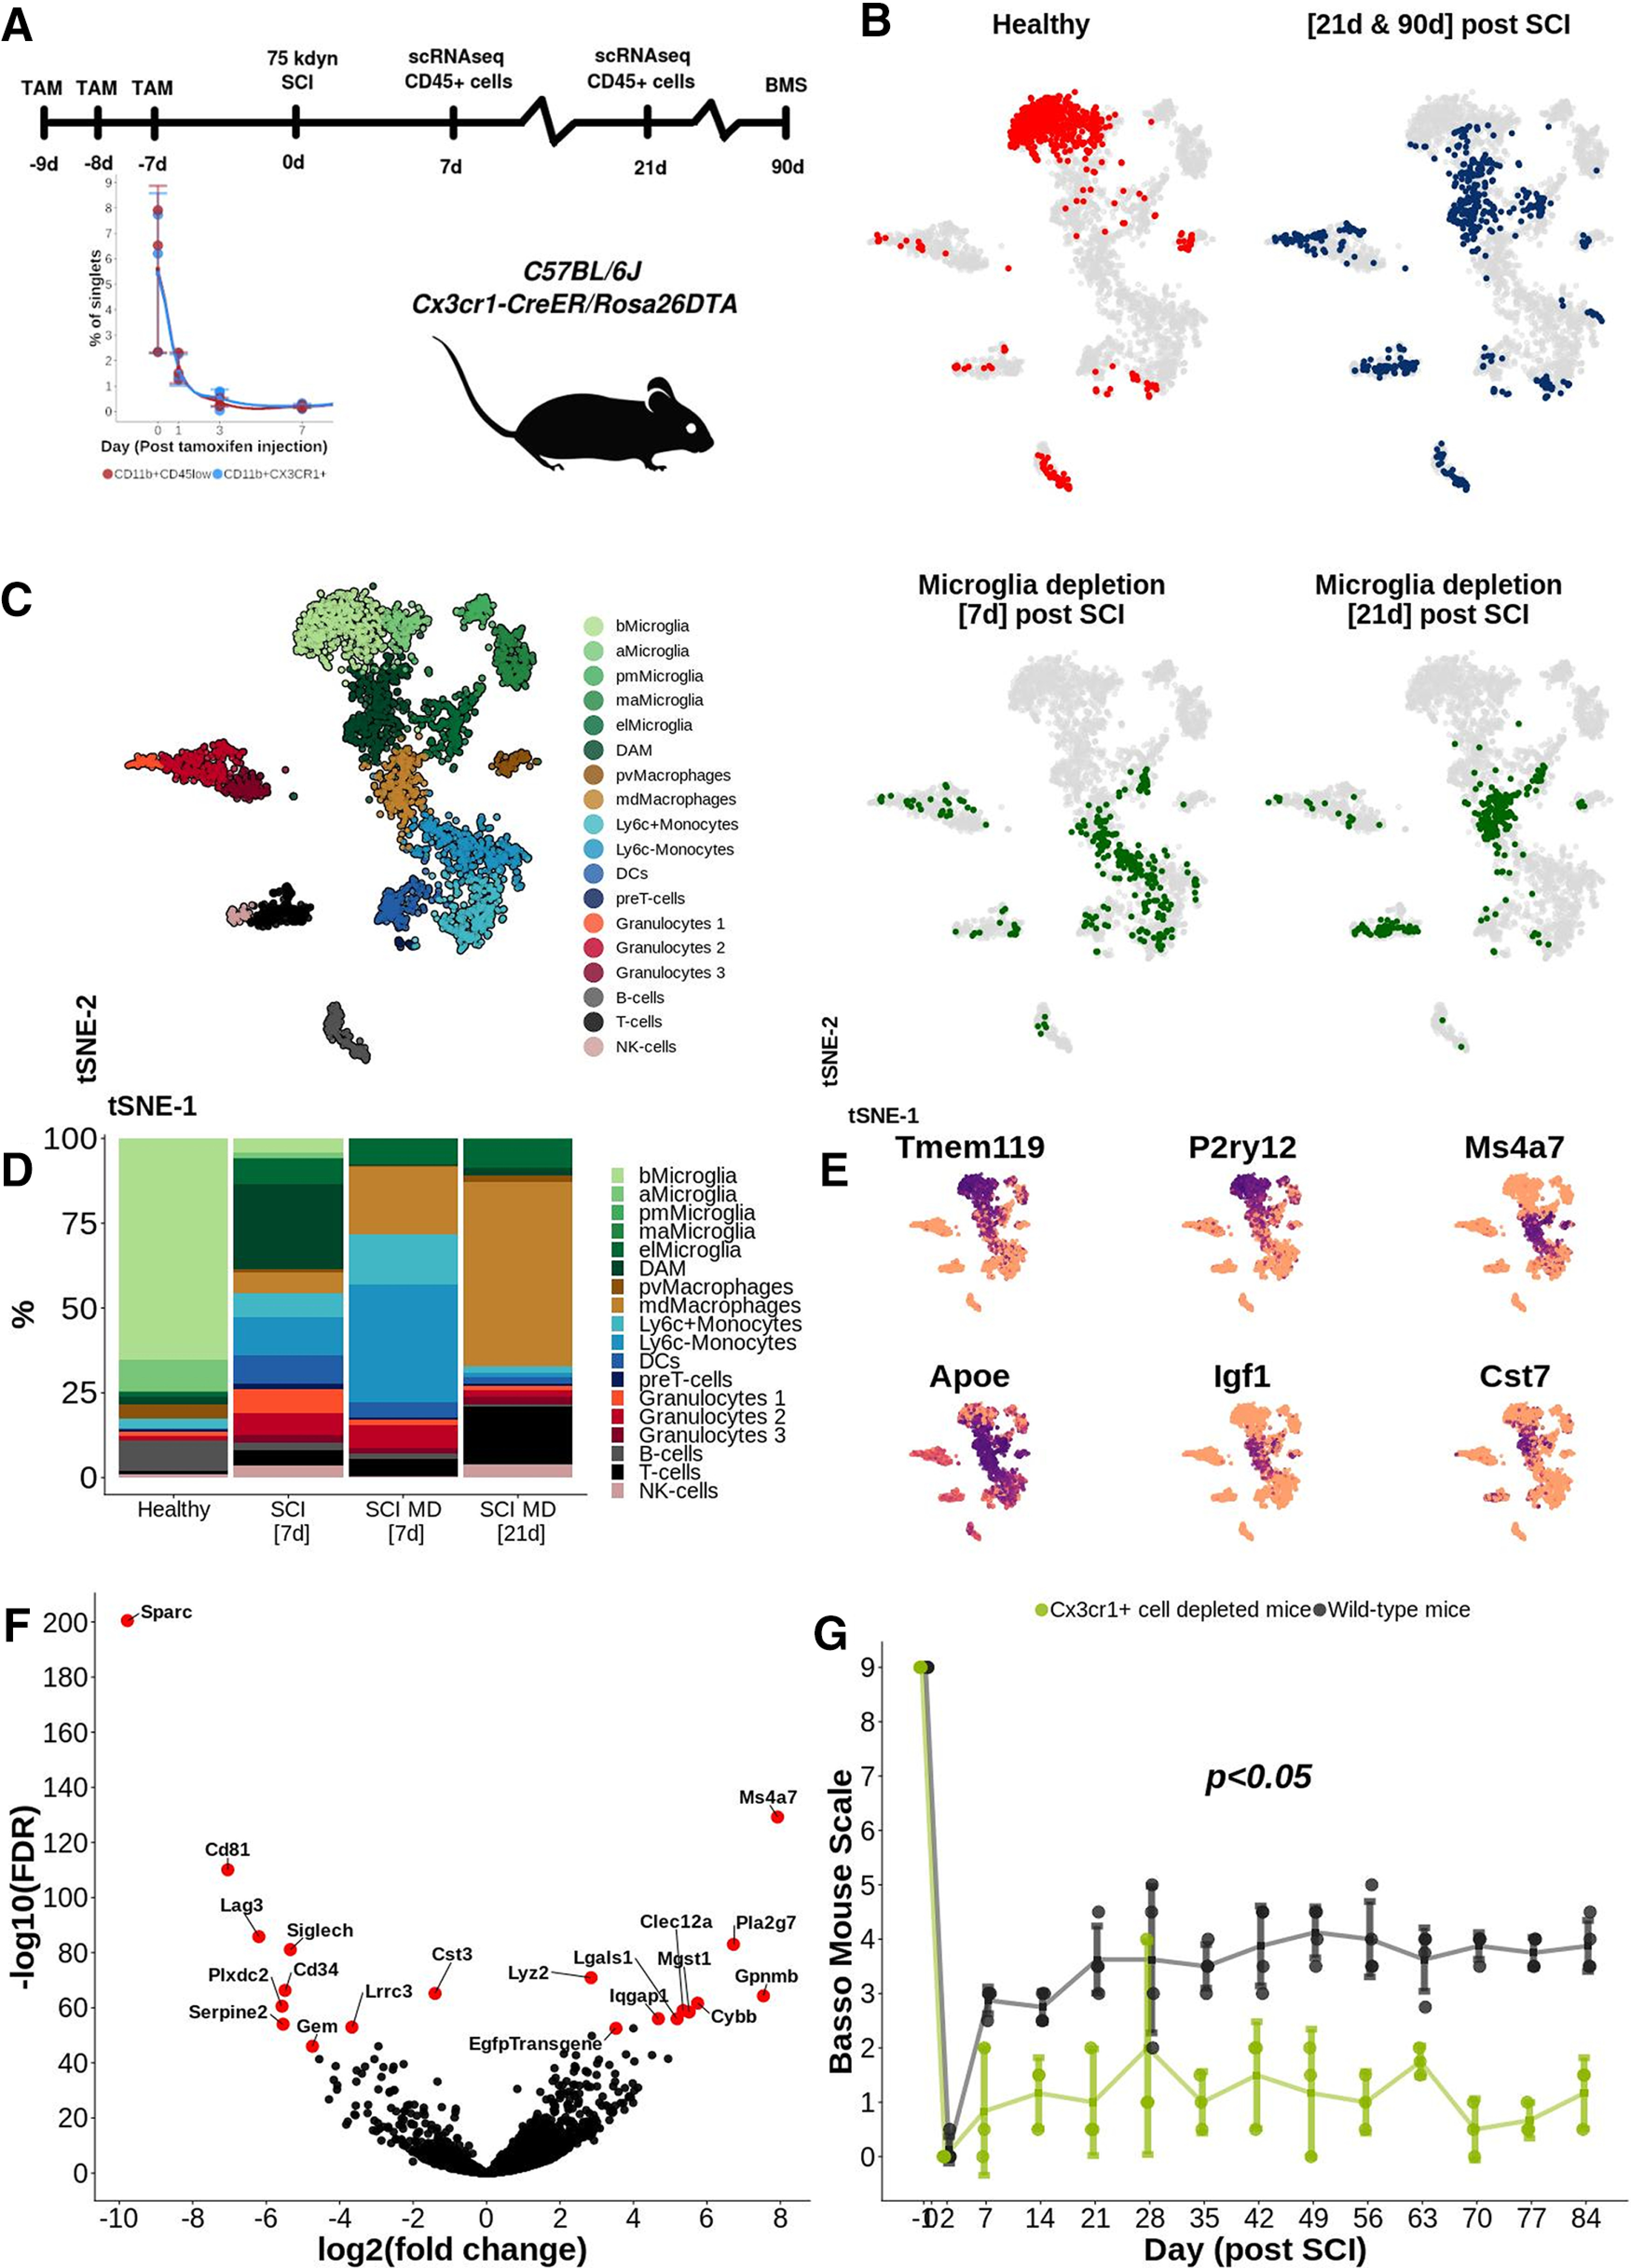
Figure 9.

A, Experimental design. TAM: tamoxifen. B, tSNE plot of 3687 CD45+ immune cells. Color indicates treatment and time point of evaluation. Cells at 21 and 90 d post-SCI are labeled using the same color in the same tSNE. Microglia depletion refers to CD45+ immune cells isolated from mice subjected to microglial depletion before SCI. C, tSNE plot of 3687 CD45+ immune cells clustered and annotated according to cell type. bMicroglia: baseline microglia; aMicroglia: activated microglia; pmMicroglia: proliferation-mediating microglia; maMicroglia: monocyte-activating microglia; DAM: disease-associated microglia in SCI; elMicroglia: embryonic-like microglia, pvMacrophages: perivascular macrophages; mdMacrophages: monocyte-derived macrophages; DCs: dendritic cells; imB-cells: immature B-cells; mB-cells: mature B-cells. D, Bar plot reporting the percentage portion which each cell type makes up out of all cells at each time point of evaluation. E, tSNE plot of 3687 CD45+ immune cells reporting log2(cpm) expression for a set of selected genes using a continuous color for each cell separately. F, Volcano plot reporting differentially expressed genes between mdMacrophages and bMicroglia. G, BMS score over time. Each dot represents one animal. Mean value for each time point and study group is surrounded by a 95% CI; *p < 0.05; ns, not significant.
