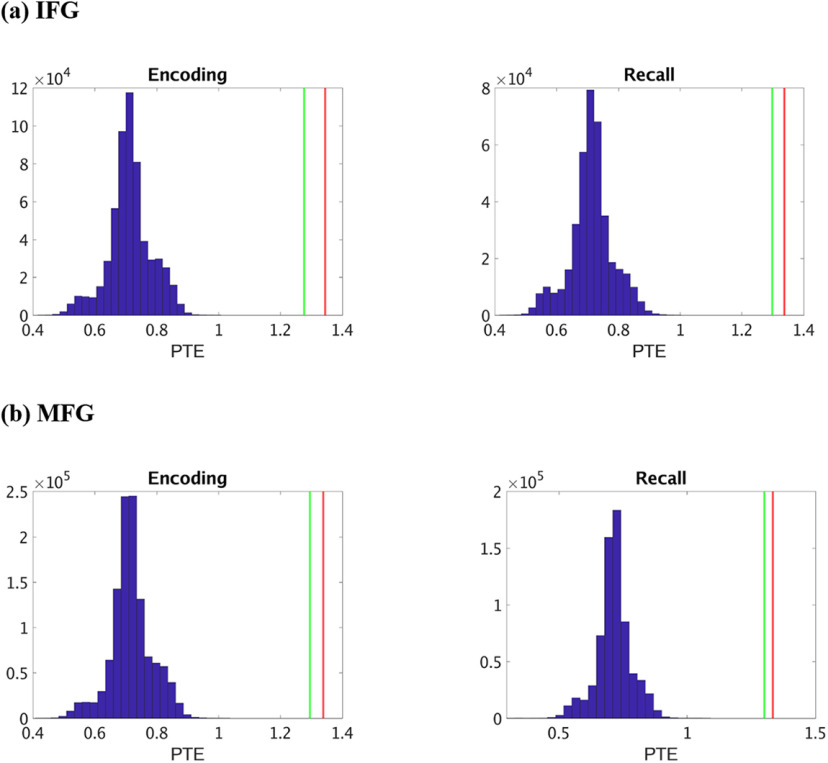
Figure 8.
Surrogate data analysis to test the statistical significance of the observed PTE values compared with those obtained by chance in delta-theta band. a, Hippocampus → IFG (HIPP → IFG) during memory encoding and recall. b, Hippocampus → MFG (HIPP → MFG) during memory encoding and recall. Blue represents the distribution of the surrogate PTE values. Red represents the observed PTE for HIPP → IFG/MFG. Green represents the observed PTE for IFG/MFG → HIPP. The estimated phases from the Hilbert transform for a given pair of brain areas were time-shuffled, and PTE analysis was repeated on these shuffled data to build a distribution of surrogate PTE values against which the observed PTE was tested (p < 0.05).

