Figure 3.
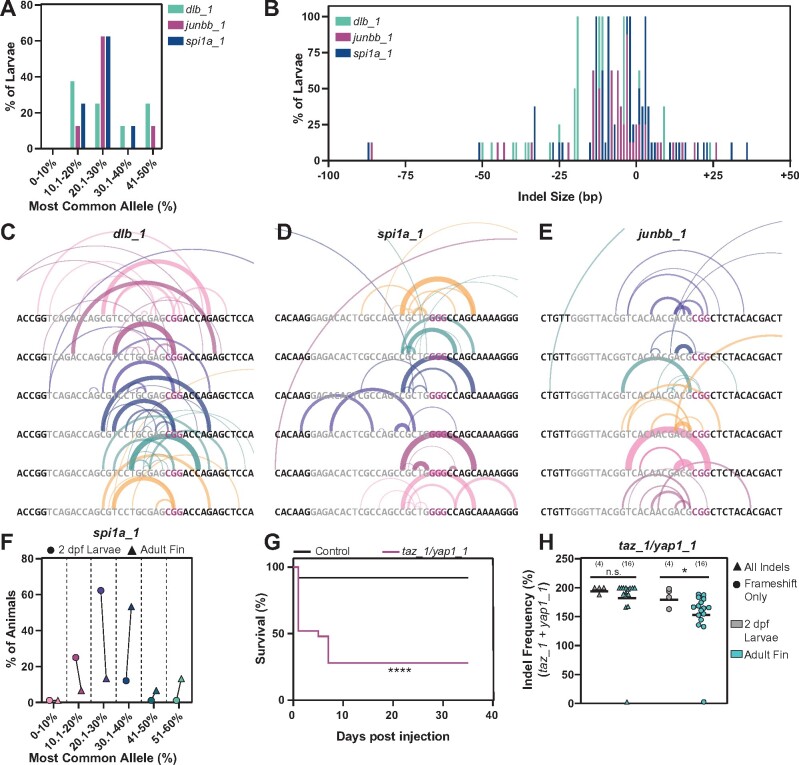
Characterization of dgRNP generated alleles (A) Frequency of occurrence of dgRNP generated alleles for dlb_1, junbb_1, and spi1a_1. NGS data shown represents eight larvae at each target site. Y-axis indicates percent larvae; X-axis categorizes the most common alleles based on their indel frequency in individual larvae. (B) Indel size distribution of dgRNP generated alleles for dlb_1, junbb_1, and spi1a_1. NGS data shown represents eight larvae at each target site. Y-axis indicates percent larvae; X-axis indicates indel size (ranging from −100 bp deletions to +50 bp insertions) (C–E) Schematics of dgRNP generated deletions in individual dlb_1 (C), spi1a_1 (D), and junbb_1 (E) larvae. Target site protospacers are shown in gray, and PAM sites in magenta. For each allele, semi-circles indicate base deletion. The weights and opacities of the semi-circles are proportional to the indel frequency of each allele. The heights of the semi-circles are proportional to deletion size. (F) The frequency for the most common allele generated by CRISPR/Cas9 dgRNPs at the spi1a_1 target site in whole 2 dpf larvae (circles) and adult caudal fin (triangles). NGS data shown represents eight animals. The percent of animals with common alleles and the prevalence of reads are shown. (G) Survival curves of 25 uninjected wild-type control (black) and 25 taz/yap1 dgRNP injected (magenta) zebrafish. (H) The indel frequency of all alleles (triangles) and frameshift only alleles (circles) at taz_1 and yap_1 target sites in whole 2 dpf larvae (gray) and adult caudal fins (teal) as measured by capillary electrophoresis. Data points represent individual animals. Indel frequency represents the sum of frequencies at the taz_1 and yap_1 target sites. Sample sizes are indicated. n.s. indicates P > 0.05; *P < 0.05; ****P < 0.0001.

