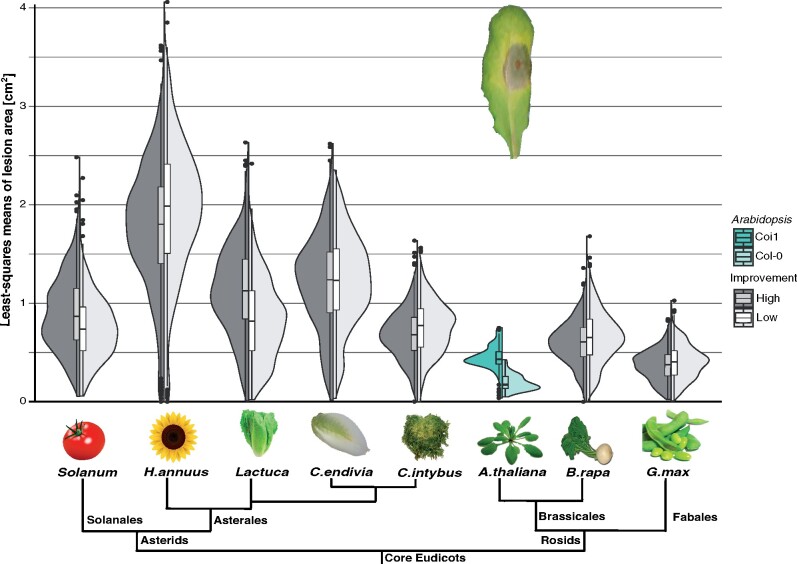
Figure 4.
Lesion areas at 72 hours post inoculation on seven crop species shows small and inconsistent effect of domestication on the B. cinerea interaction. Half-violins and boxplots (median and interquartile range) represent the mean lesion area distribution of high (black, n = 588) and low (gray, n = 588) improvement genotypes for all 98 Botrytis strains. Lactuca refers to L. sativa for high and L. serriola for low improvement genotypes. Solanum refers to S. lycopersicum for high and S. pimpenellifolium for low improvement genotypes. As reference, virulence on A. thaliana wild-type (Col-0, n = 98) and jasmonic acid signaling mutant (coi1, n = 98) are presented. The nonscaled tree represents the phylogenetic relationship between eudicot species. A lesion example on an A. thaliana leaf is provided.

