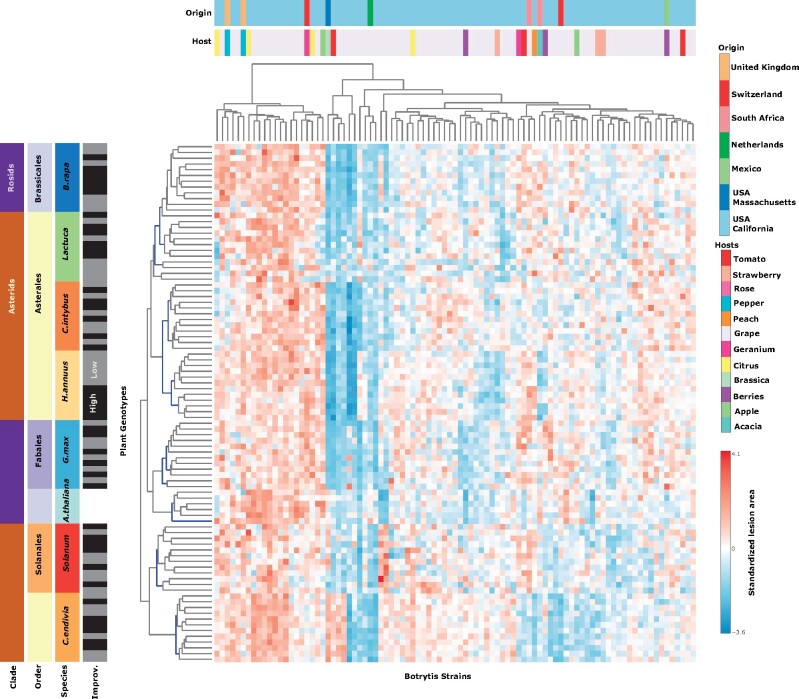
Figure 6.
Variation of plant susceptibility in the Botrytis pathosystem is species specific and does not track plant evolution. Heatmap of standardized (z-scored) least-squares means of lesion area (n = 6) for Botrytis strains (x-axis) interacting with 90 plant genotypes (y-axis). The strains were isolated largely in California (light blue in the origin bar) and on grape (light purple in the host bar). For A. thaliana, five single gene knockout mutants and the corresponding wild-type Col-0 are presented. For the seven crop species, six genotypes with low (gray) and high (black) improvement are presented. The seven crop species were chosen to represent a wide spectrum of phylogenetic distances across Rosids (Brassicales and Fabales) and Asterids (Asterales and Solanales). Branches in the dendrogram that are supported with 95% certainty after bootstrapping are indicated in blue. No branches in the Botrytis strain dendrogram were significant.

