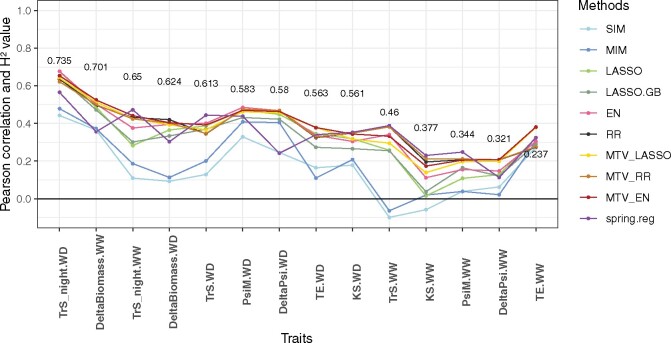
Figure 3.
Mean genomic predictive ability (Pearson’s correlation between genotypic BLUPs and their predicted values), obtained by cross-validation for 10 methods applied to 14 traits related to water deficit and GBS gene-dose data, within a grapevine bi-parental population. Broad-sense heritability values are reported for each trait (y-position of the number corresponds to heritability estimate). Traits are ordered by decreasing heritability. For each trait, predictive ability is averaged over 10 cross-validation replicates × 5 cross-validation folds).

