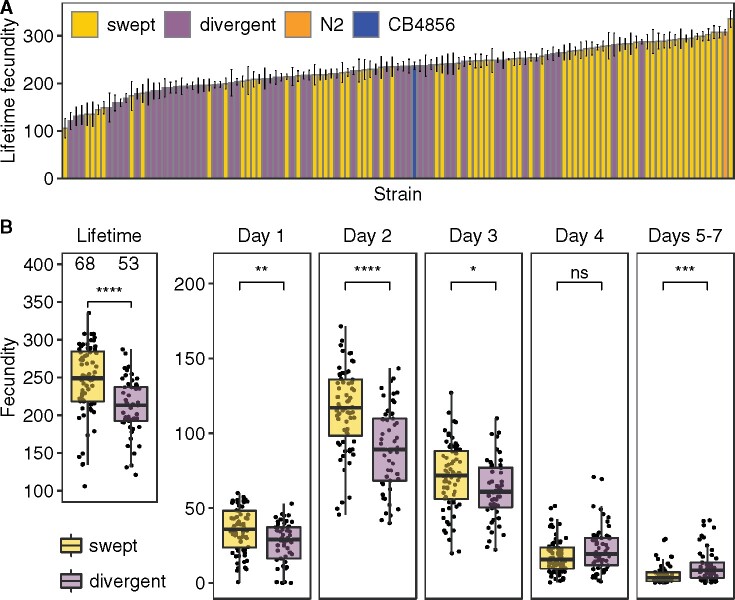
Figure 2.
Natural variation in C. elegans fecundity. (A) A bar plot for lifetime fecundity (y-axis) of 121 wild C. elegans strains is shown. Strains on the x-axis are sorted by their MLF of two to five biological replicates. Error bars show standard errors of lifetime fecundity among replicates. The lab reference strain N2 and the Hawaii strain CB4856 are colored orange and blue, respectively; other strains are colored gold for swept strains and purple for divergent strains. (B) Comparisons of lifetime and daily fecundity between 68 swept strains (gold) and 53 divergent strains (purple) are shown as Tukey box plots. Statistical significance was calculated using the Wilcoxon test and was corrected for multiple comparisons (Holm method). Significance of each comparison is shown above each comparison pair (ns: adjusted P-value > 0.05; *: adjusted P-value ≤ 0.05; **: adjusted P-value ≤ 0.01; ***: adjusted P-value ≤ 0.001; ****: adjusted P-value ≤ 0.0001).

