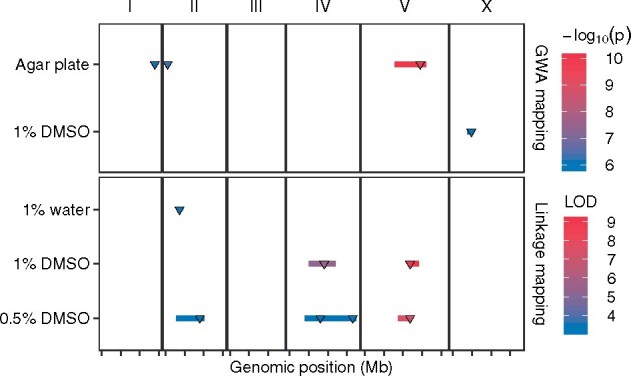
Figure 5.

Multiple QTL impacting C. elegans lifetime fecundity in different conditions. Four GWA mapping QTL of two conditions (121 strains cultured in agar plate and 236 strains cultured in liquid with 1% DMSO) and seven linkage mapping QTL of three conditions (C. elegans RIAILs cultured in liquid with 1% water, 1% DMSO, and 0.5% DMSO, respectively) are plotted. Each condition is plotted on the y-axis against the genomic position of its QTL on the x-axis separated by chromosomes with tick marks denoting every 5 Mb. Each QTL is plotted as a line with a triangle indicating the peak marker and colored by the −log10(p) value (GWA QTL) or the logarithm of the odds (LOD) score (for linkage mapping QTL), increasing in significance from blue to red.
