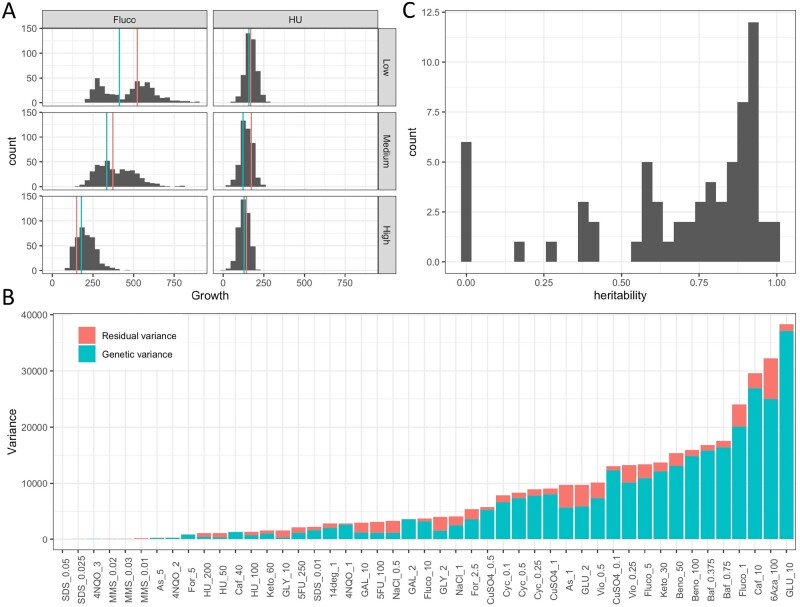
Figure 1.
Distribution, genetic variance, and heritability of the media. (A) Distribution of growth for F1 offspring. Red and blue vertical lines represent the parental value of LA128 and LA136, respectively. Facets Low, Medium, and High represent an increase in the concentration level with 1–5–10 µg/mL of fluconazole and 20–100–200 µg/mL for hydroxyurea. (B) Variance in the F1 offspring per media. The total variance is composed of the genetic variance and residual variance. (C) Distribution of the H2 estimated for the 48 media.

