
Figure 2.
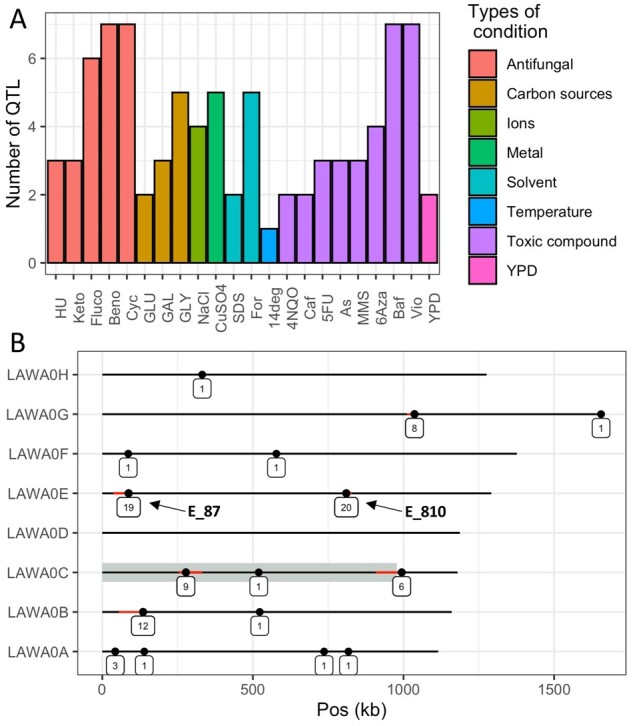
Overview of the identified QTL. (A) Number of QTL identified per condition. (B) Genomic location of the QTL identified for all conditions. Each dot indicates the presence of at least one QTL. If more than one QTL is found in the same 50 kb window, the dot indicates the QTL with the best P-value and the red line show the boundary of the other QTL location. The number of QTL associated to each spot is indicated below each dot. Grey shadow represents the left arm of chromosome C.