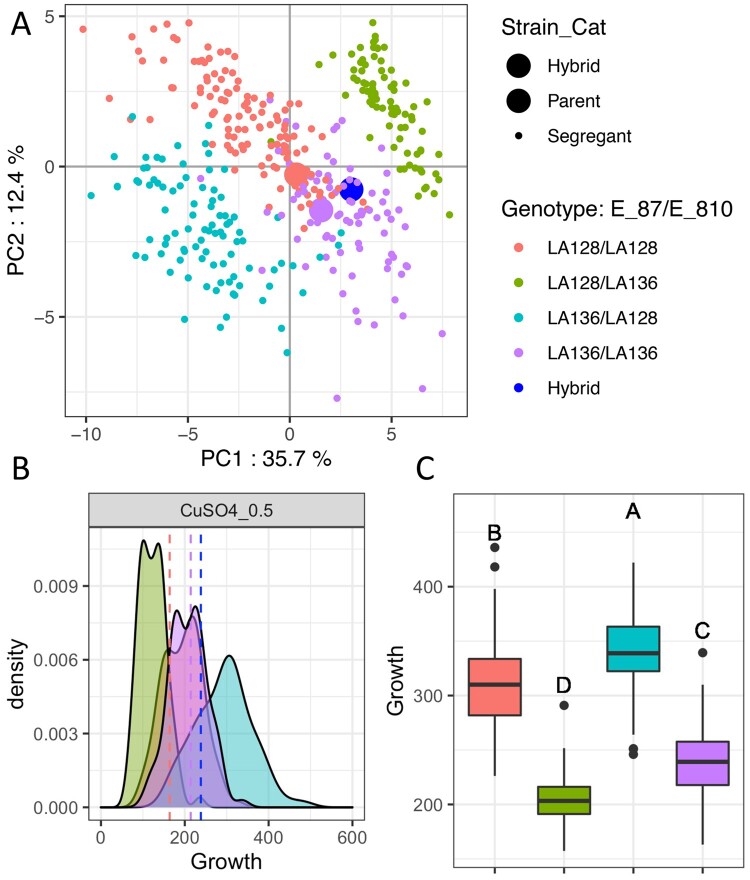
Figure 3.
Overall effect of the two QTL hotspots detected. (A) PCA performed with the growth measured from all conditions for the F1 population, parental strains and hybrid. The color by genotype for E_87 and E_810 QTL is the same for all panels. (B) Growth distribution of the segregants in copper sulfate 0.5 mM according to their genotype. Vertical dashed lines represent the parental strains and the hybrid. (C) Additive effect of E_87 and E_810. The boxplot represents the segregant growth in all media according to their genotype. A different letter indicates a significant difference (Tukey honest significant differences, confidence level = 0.95).

