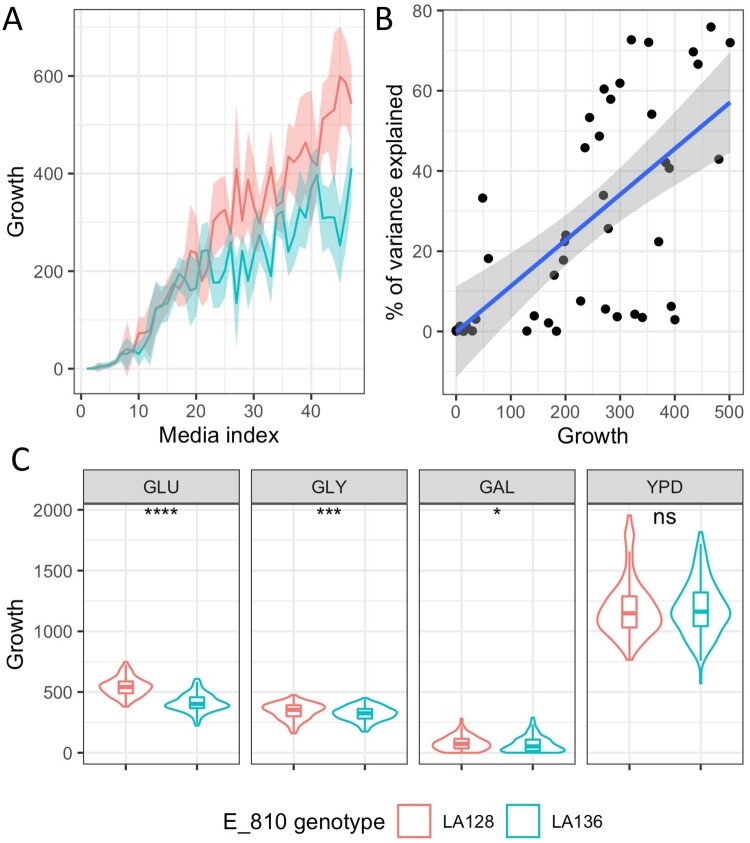
Figure 4.
Effect of the E_810 QTL hotspot. (A) Each line represents average growth of the F1 offspring across the 48 conditions according to the E_810 genotype. Conditions are sorted according to the average growth of the F1 offspring. (B) Average growth per medium according to the variance explained by E_810. Each dot represents a condition for which E_810 is identified as QTL. (C) Growth of F1 offspring according to E_810 inheritance and carbon source glucose 2% (GLU), glycerol 2% (GLY), galactose 2% (GAL), or media base SC vs YPD. Wilcoxon–Mann–Whitney test was applied to assess the significance of the phenotypic difference between the relevant pairs. The level of significance is indicated as follows: ns: not significant, *P ≤ 0.1, **P ≤ 0.05, ***P ≤ 0.01. Linkage analysis, which is more stringent than Wilcoxon–Mann–Whitney test due to multiple tests correction by permutations does not link significantly E_810 to galactose.

