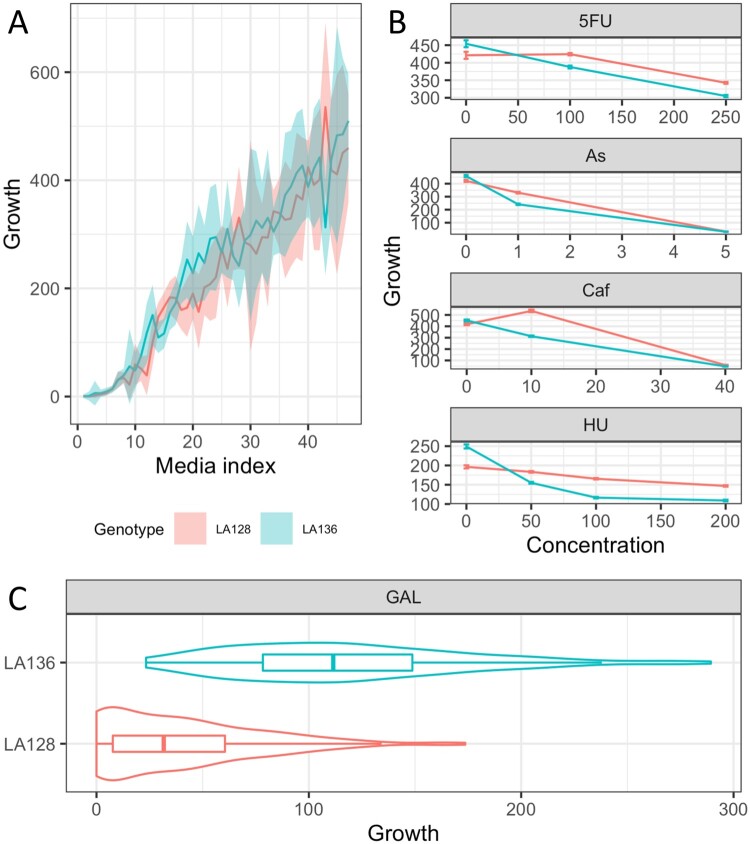
Figure 5.
Effect of the E_87 QTL hotspot. (A) Each line represents average growth of the F1 offspring across the 48 conditions according to the E_87 genotype. Line media are sorted according to the average growth of F1 offspring. (B) Reaction norm of F1 offspring for some specific conditions. (C) Growth of F1 offspring according to E_810 inheritance in galactose 2%.

