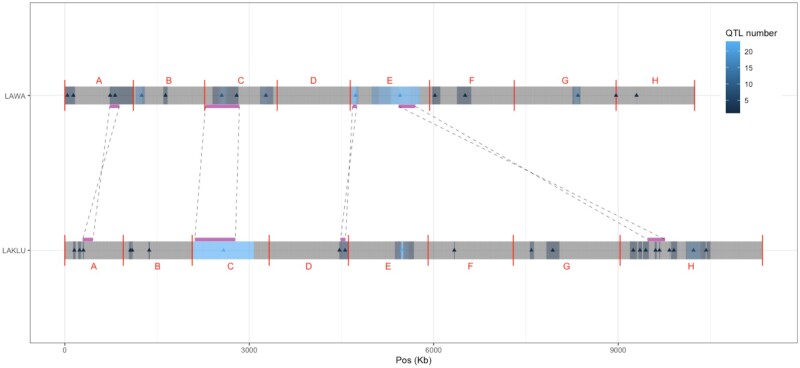
Figure 6.
QTL distribution comparison. The genomes of L. waltii (LAWA) and L. kluyveri (LAKLU) are shown. The vertical red lines represent the boundaries of the chromosomes and letters represents the names of the chromosome. The number of QTL identified per 1 kb window is indicated and identified by a triangle at the best marker position. All shared synteny blocks that contain at least one best QTL marker in each species are represented by the purple lines and linked to their corresponding position in the other genome by dash lines.

