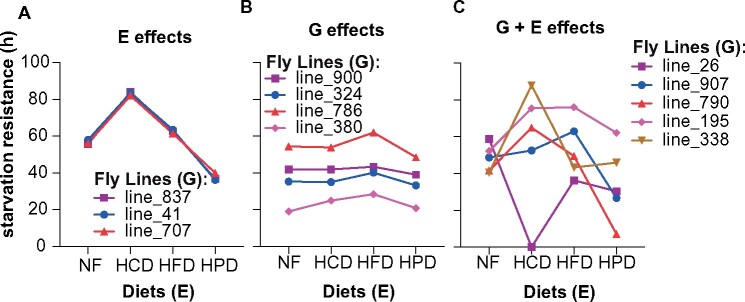
Figure 2.
Gene-by-diet interactions. Mean starvation resistance is shown for selected DGRP lines on the four diets. Selected DGRP lines to illustrate either only environmental (E) effects (A), only (or mainly) genetic (G) effects (B) or a gene by environment (G + E) interaction (C) on starvation resistance.

