Figure 3.
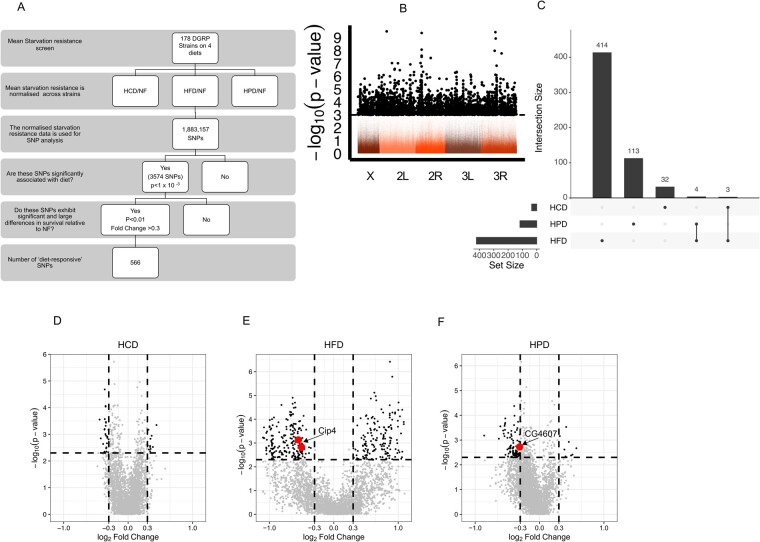
Mapping the SNPs in diet-responsive genes (A) Schematic of SNP analysis used in this study. (B) Manhattan plot of the MANOVA SNP analysis shows all SNPs with 3574 significant SNPs (P-value of < 1 × 10⁻³, dashed line) in black. The x-axis represents the fly chromosomes and y-axis displays -Log (P-value) of the MANOVA. (C) An upset plot indicating the degree of overlap of the numbers of highly significant SNPs between each diet and the number of SNPs per diet. (D–F) Volcano plots of Wilcoxon Test of the 566 significant SNPs in (C) for HCD (D), HFD (E), and HPD (F). The y-axis shows the -Log (P-value) of the Wilcoxon Test and the x-axis displays the Log2 fold change in starvation resistance of the indicated diet compared to NF. Highly significant SNPs with a P-value <0.01 and a fold change >±0.3 are in black with validated genes labeled and indicated in red.

