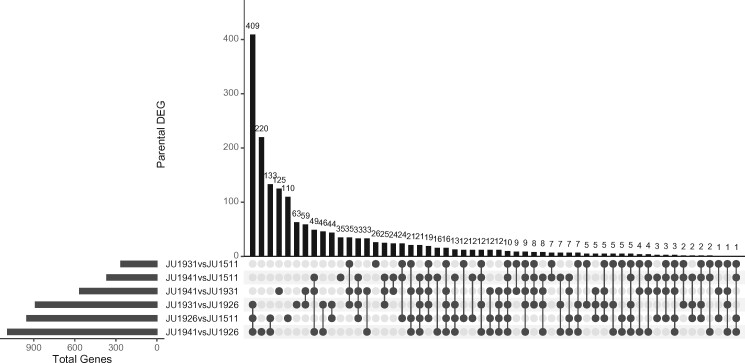
Figure 1.
Gene expression differences between the four mpRIL parental lines. Upset plot shows the pairwise comparisons and the overlap between the pairs (Tukey’s HSD; P < 0.001; FPR = 0.05). The horizontal bar plot shows the number of DEG per parental pair, while the vertical bar plot indicates the number of shared DEG per comparison. For example, an overlap of 409 genes was found between the three comparisons that include the JU1926 parental line, which shows that JU1926 differed most from all other lines.

