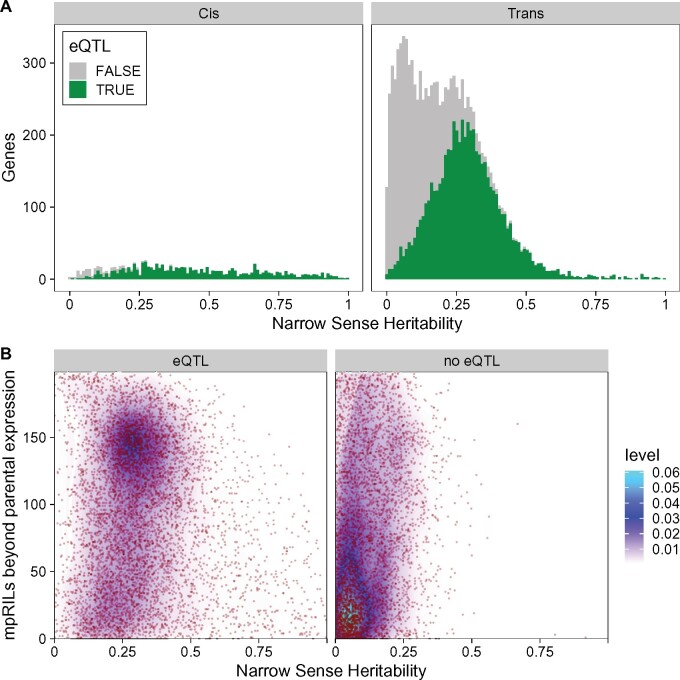
Figure 4.
Relation between eQTLs, transgression, and narrow-sense heritability (h2). (A) Narrow-sense heritability (h2; x-axis), distribution in genes (y-axis) with cis- and trans-eQTLs, significance of the eQTLs is TRUE (green) when -log10p >5.35 and FALSE (grey) otherwise. (B) Relation between narrow-sense heritability (h2; x-axis) and transgression (y-axis) for genes with and without a significant eQTL, individual datapoints shown in red, color gradient indicates datapoint density.

