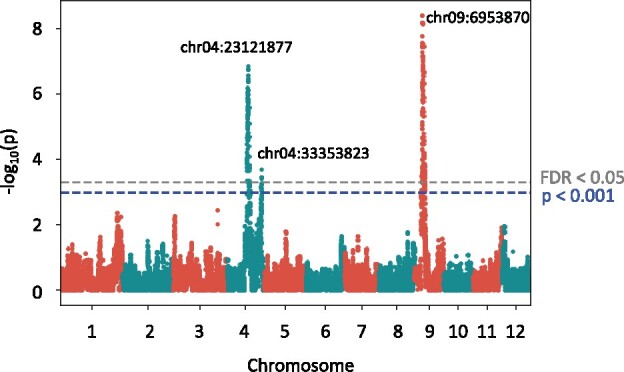
Figure 2.

Quantitative trait locus analysis of rice seed hull color. Manhattan plot showing the significant association of SNPs with seed hull color phenotype as calculated by GWASpoly (Rosyara et al. 2016). The y-axis shows the –log10 (p) value of each SNP. The x-axis shows the genomic position. The blue dashed line indicates the significance, i.e., –log10 (p) > 3. The value corresponding to FDR <0.05 is given in gray dashed line. Only SNPs located near chr04:23121877, chr04:33353823, and chr09:6953870 exceeded the threshold P < 0.001 and FDR <0.05.
