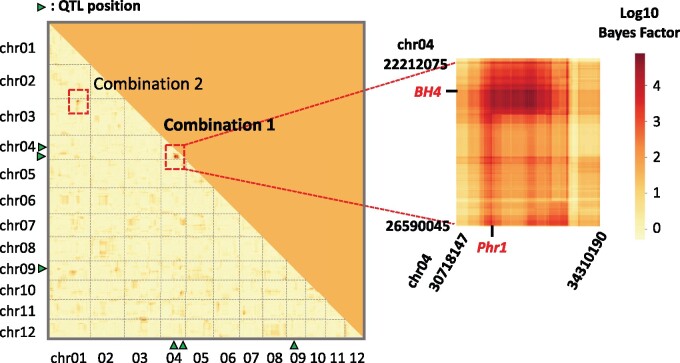
Figure 3.
Heatmap showing Bayes factors for combinations of SNPs as revealed by RIL-StEp for rice hull color. The left heatmap shows the Bayes factors of SNP combinations over the whole genome. In Combination 1 (chr04:22212075–26590045 × chr04:30718147–34310190) and Combination 2 (chr01:30334348–31519089 × chr03:2401129–3212328), Bayes factors of combinations of SNPs located between two regions were >100. Positions of major QTLs are indicated by green triangles. The right heatmap magnifies genomic regions that potentially include epistatic genes. Names of candidate genes possibly involved in the epistasis are indicated by red color.

