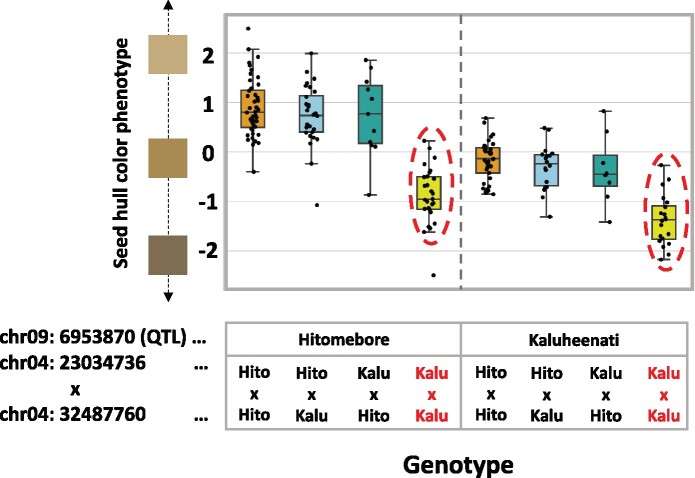
Figure 4.
Relationships between rice seed hull color phenotypes and genotypes of the three loci. A boxplot showing the phenotypic values of RILs with different combinations of genotypes at SNPs on chr04:23034736, chr04:32487760, and chr09:6953870. The horizontal line inside each box represents median value. Box range is the first and third quantile. The whisker extends to last datum less than the third quantile + 1.5*interquartile range (IQR) and the first datum greater than the first quantile—1.5*IQR. The x-axis shows the combinations of genotypes. The y-axis shows phenotypic values. When SNPs on chr04:23034736 and chr04:32487760 both have Kaluheenati genotypes, phenotypic values tended to be low (indicated by red circles and red characters), whereas in other combinations, the values were higher and similar.

