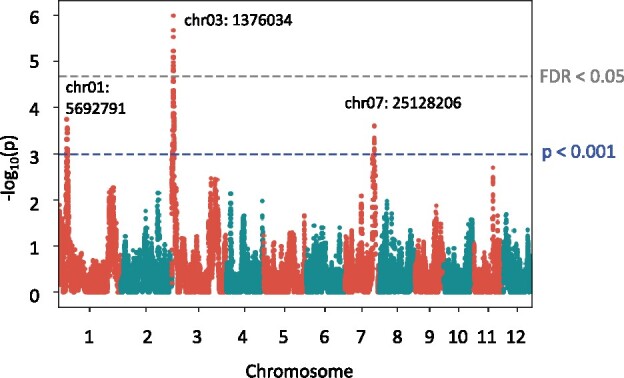
Figure 6.

Quantitative trait locus analysis of leaf chlorophyll content. A Manhattan plot showing the significant association of SNPs with leaf chlorophyll content as calculated by GWASpoly (Rosyara et al. 2016). The y-axis shows the –log10(p) value of each SNP. The x-axis shows the genomic position. Blue dashed line indicates the significance, i.e., –log10(p) >3. The value corresponding to FDR <0.05 is given in gray dashed line. SNPs located near chr01:5692791, chr03:1376034, and chr07:25128206 exceeded the threshold (P < 0.001) and only SNPs close to chr03:1376034 exceeded FDR <0.05.
