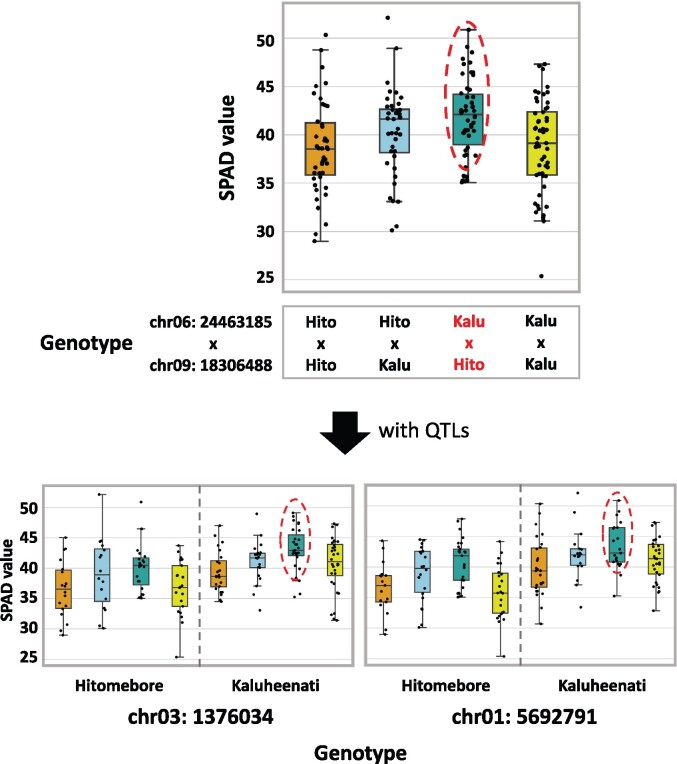
Figure 8.
Relationships between leaf chlorophyll content phenotypes and genotypes of the epistatic loci of Combination 1. Top boxplot shows the phenotypic values of RILs with different combinations of genotypes at SNPs on chr06:24463185 and chr09:18306488. The horizontal line inside each box represents median value. Box range is the first and third quantile. The whisker extends to last datum less than the third quantile + 1.5*interquartile range (IQR) and the first datum greater than the first quantile—1.5*IQR. The x-axis shows the combinations of genotypes. The y-axis shows phenotypic values. Bottom boxplots show the phenotypic values of RILs with different combinations of genotypes of epistatic loci and QTLs. When the genotype at the SNPs on chr06:24463185 is Kaluheenati and on chr09:18306488 is Hitomebore, phenotypic values tended to be high (indicated by red circles and red characters).

