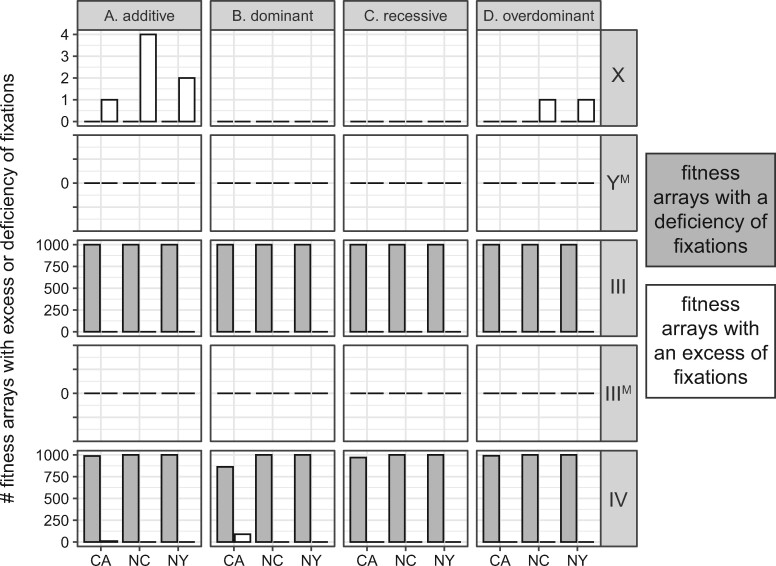
Figure 3.
Bar plots show the number of fitness arrays that result in a deficiency (gray) or excess (white) of fixations of each proto-sex chromosome (X, YM, III, IIIM, or IV) in a finite population, relative to simulations in which there are no fitness differences across proto-sex chromosomes (i.e., drift only). The fitness arrays are the 1000 best-fitting fitness values for each population (CA, NC, or NY) when simulations were started with equal frequencies of all genotypes. Fitness effects of the proto-Y chromosomes are either (A) additive, (B) dominant, (C) recessive, or (D) overdominant.

