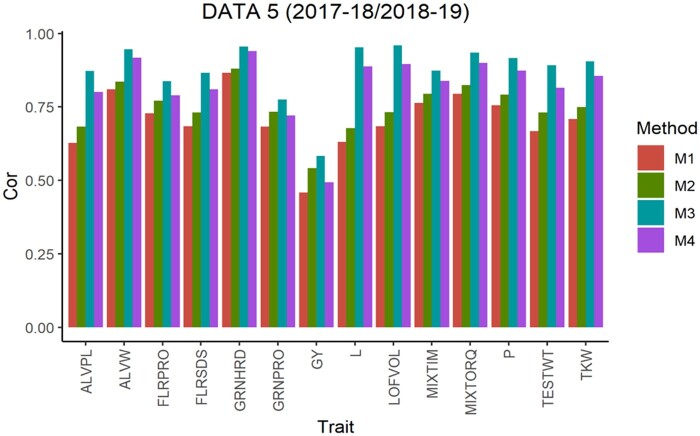
Figure 5.
Data 5 (2017–2018/2018–2019). Average Pearson’s correlation (Cor) computed with four methods. Method 1 (M1): Pearson’s correlation between observed phenotypic values and predicted breeding values. Method 2 (M2): Pearson’s correlation computed dividing method 1 by the square-root of the heritability. Method 3 (M3): Corrected Pearson’s correlation proposed by Runcie and Cheng (2019). Method 4 (M4): Pearson’s correlation computed multiplying method 3 by

