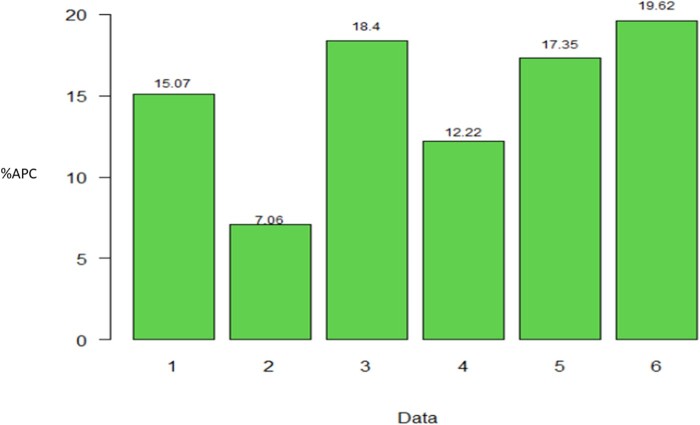
Figure 7.
Percentage of relative differences between the average Pearson’s correlation (%APC) of method 3 with regard to the APC of method 2, across traits where the former resulted in larger APC values, for each data set (data 1–6). For the data set 1, 2, 4, and 5 in all traits the APC value of method 3 was larger than APC of method 2, and also this happened in 10 and 13 out 14 traits, for data sets 3 and 6, respectively.

