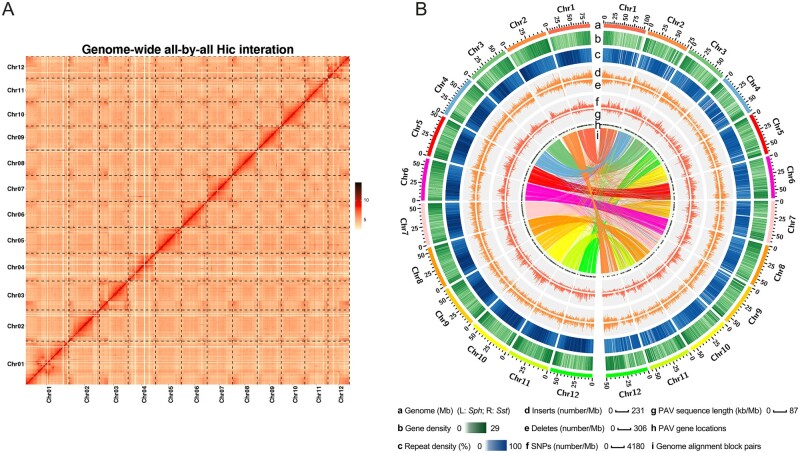
Figure 1.
Features of the Sst genome. (A) Sst Hi-C contact data mapped on the Sst genome. Strong signals were observed on diagonal regions, indicating that the scaffolds were accurately oriented on the pseudochromosomes. (B) Comparison of the genomic landscapes of Sst and Sph. (a) Distribution of chromosomes in the Sph (left) and Sst (right) genomes. (b and c) Gene and repetitive element density in 1 Mb sliding windows. (d and e) Distribution of insertion and deleted regions in the Sst genome in 1 Mb sliding windows. (f) Numbers of single nucleotide polymorphisms between the two genomes in 1 Mb sliding windows. (g) Distribution of presence-absence variation sequences in 1 Mb sliding windows. (h) Locations of PAV sequences on chromosomes. (i) Gene pairs between Sst and Sph genomes, identified using the best-hit method.

