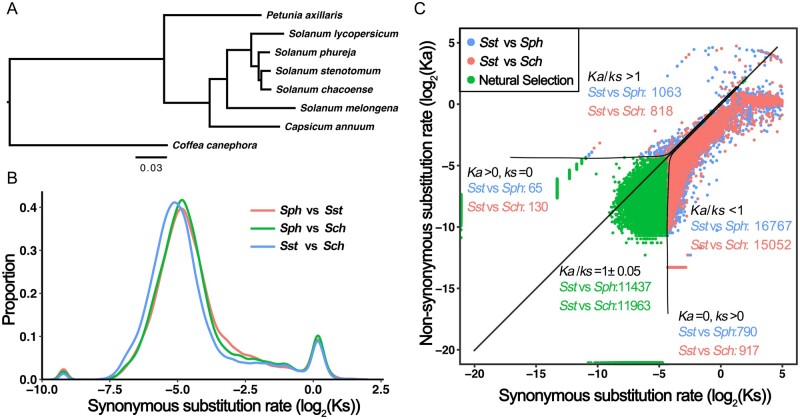
Figure 2.
Signatures of rapid evolution among potato species Sst, Sph, and Sch. (A) Phylogenetic tree of eight closely related Solanum species constructed from a concatenated alignment of single-copy genes. (B) Synonymous substitution rate (Ks) distribution of orthologous gene sets among Sst, Sph, and Sch. Horizontal and vertical axes represent the log2 values of the synonymous substitution rate and proportion, respectively. (C) Chart showing the synonymous (Ks) and nonsynonymous (Ka) substitution rates, and selection pressure (Ka/Ks) between Sst and Sph and between Sst and Sch. Ka/Ks = 1 indicates genes with neutral selection, Ka/Ks > 1 indicates positive selection, and Ka/Ks < 1 indicates negative selection.

