
Figure 1. Caloric Intake and Energy Balance in Okinawa vs. the U.S.
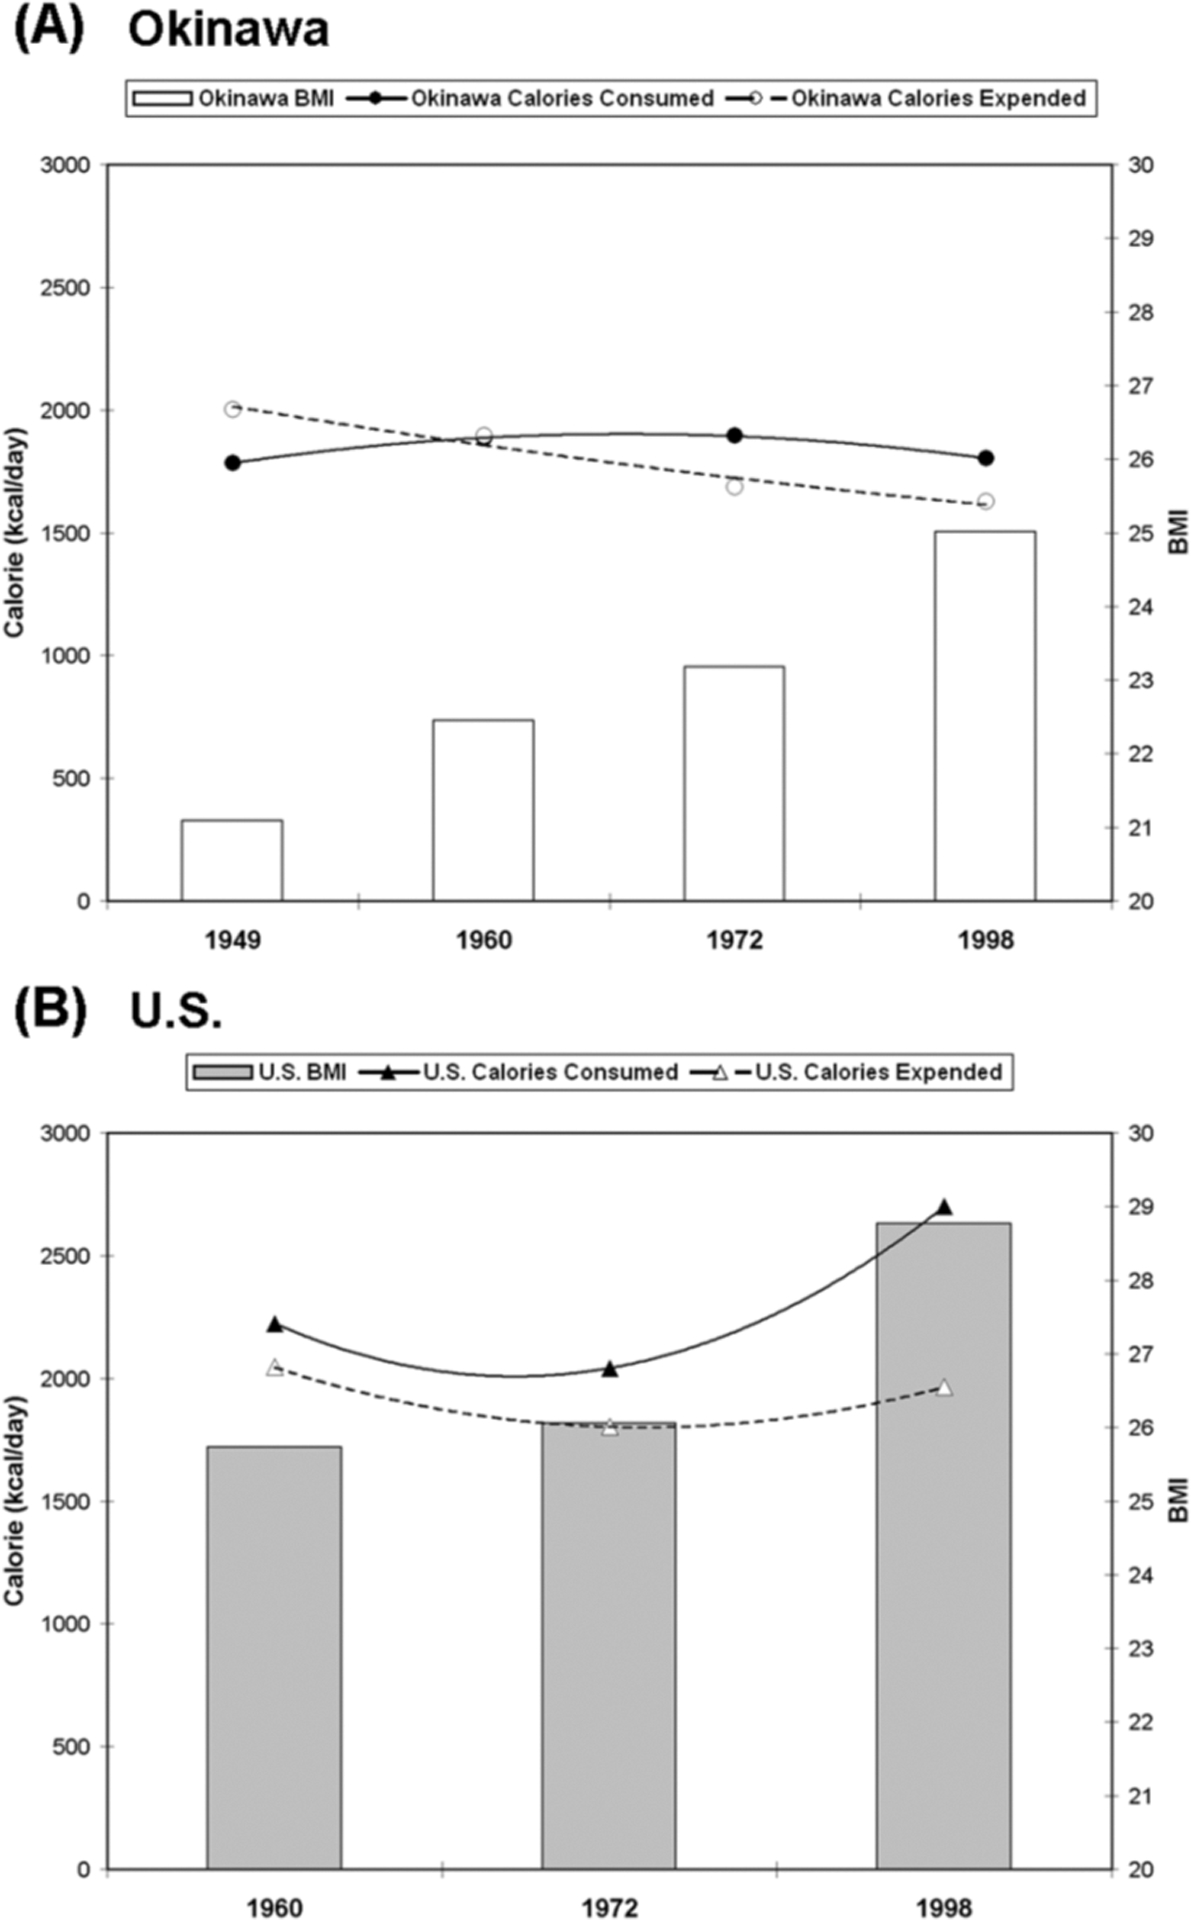
Data for the Okinawan population indicate that consistent positive energy balance did not occur until the 1960s, corresponding to late adulthood/early middle age for the Okinawans (A) but the U.S. population has been in positive energy balance since measurements began circa 1960 (B). Data also indicate markedly higher BMI in Americans vs. Okinawans at all ages and time points.