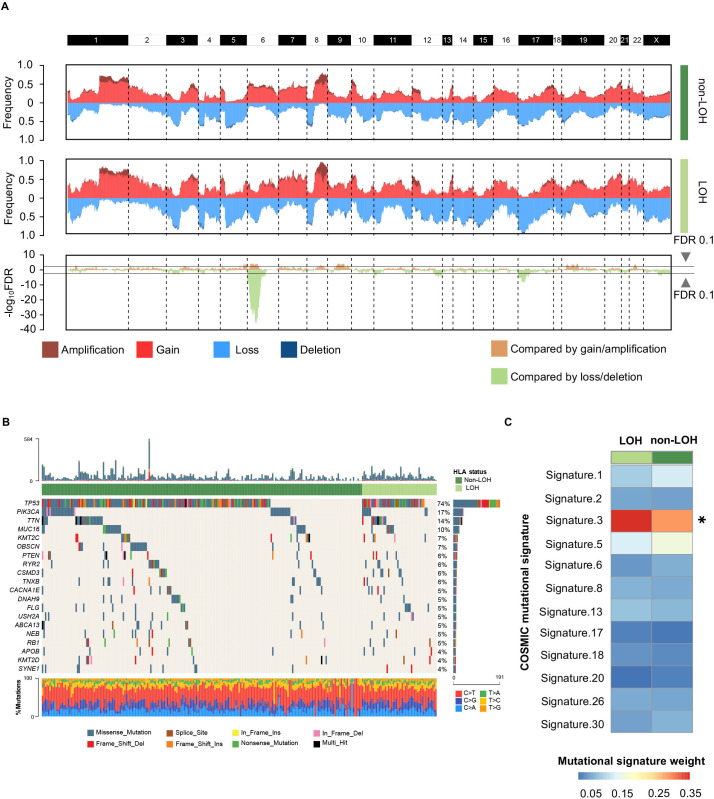
Figure 2.
Genomic alterations between different HLA-I LOH statuses in TNBCs. (A) Comparison of the somatic copy number variations between HLA-I non-LOH groups and HLA-I LOH groups. The top two plots illustrate the frequency of the amplification (dark red), gain (light red), loss (light blue), and deletion (dark blue) of each gene in each cluster, and the bottom plot illustrates the –log10 FDR value of each gene when compared among all four clusters in the amplification-centric (light yellow) or deletion-centric (light green) calculations. (B) Somatic mutation profile in HLA-I LOH and HLA-I non-LOH patients. Top 20 most frequent genes are shown. (C) Heatmap showing the contribution of breast cancer-related mutational signatures to HLA-I non-LOH and HLA-I LOH. HLA, human leukocyte antigen; LOH, loss of heterozygosity; TNBCs, triple-negative breast cancers; *p<0.05.

