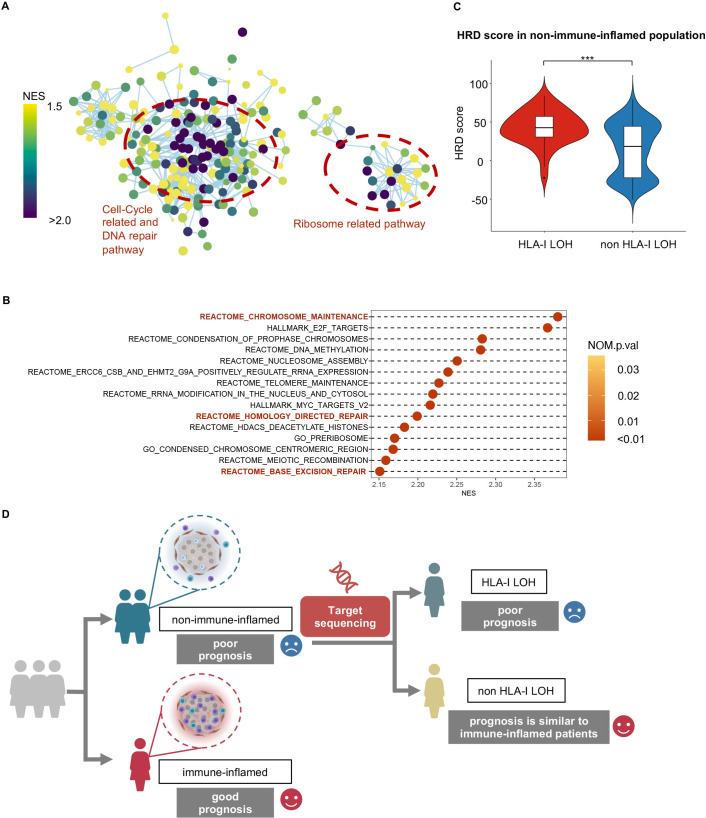
Figure 4.
High homologous recombination deficiency in non-immune-inflamed TNBCs with HLA-I LOH. (A) Enrichment map shows pathways enriched in non-immune-inflamed TNBCs with HLA-I LOH when compared with non-immune-inflamed TNBCs with HLA-I non-LOH. Nodes in the network represent pathways, and similar pathways with many common genes are connected. Groups of similar pathways are indicated. The size and color of each node represent the p-value and NES value of each pathway, respectively. All pathways included were statistically significant (p-value <0.05 and q-value <0.25). (B) Cleveland plot shows the top 15 statistically significant pathways (p-value <0.05 and q-value <0.25) with the highest NES value. All pathways included are statistically significant. (C) Comparison of homologous recombination deficiency scores between the HLA-I LOH and non-LOH groups in non-immune-inflamed tumors. (D) Potential clinical translations of HLA-I LOH status. ***, p<0.001. HLA, human leukocyte antigen; LOH, loss of heterozygosity; NES, normalized enrichment score; TNBCs, triple-negative breast cancers.

