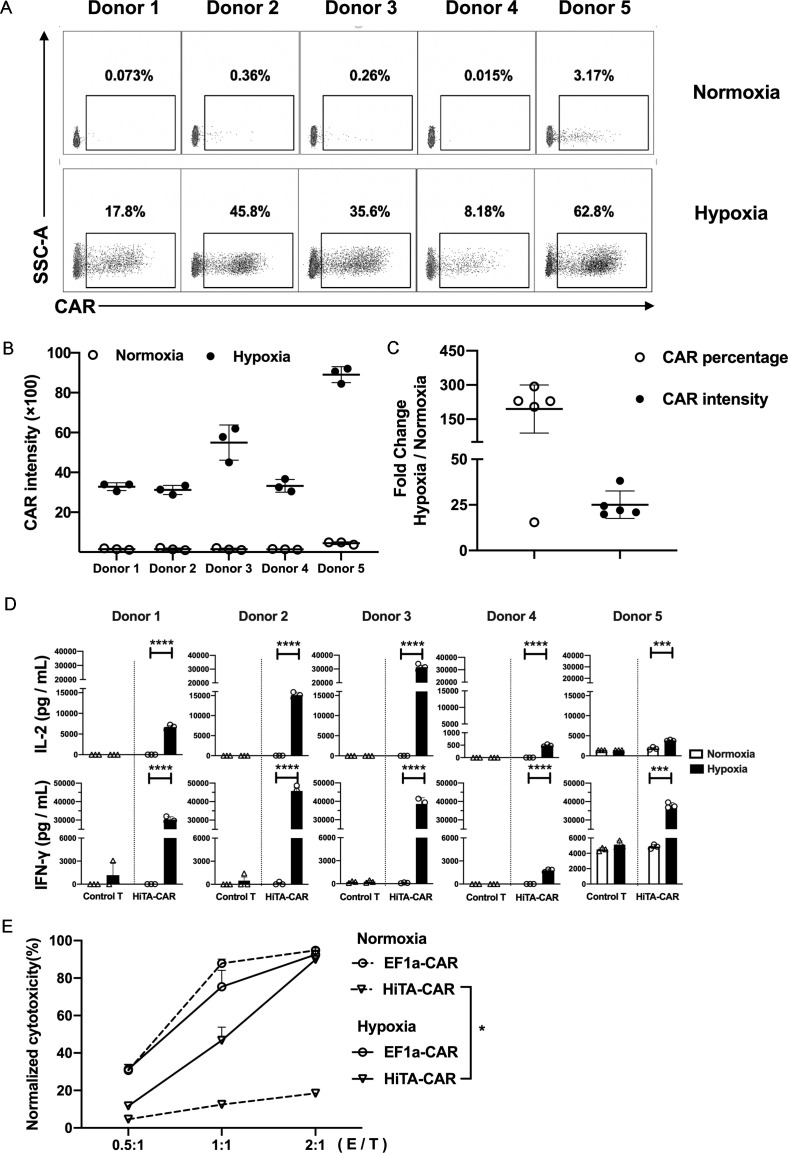
Figure 4.
Stringent oxygen control of effector functions of HiTA-CAR-T cells. HiTA-CAR T cells were cocultured with SKOV3 cells in hypoxic and normoxic conditions for 24 hours at E/T ratio of 3:1 (n=5 donors) (A–D). (A) The Surface CAR expression on HiTA-CAR T cells were assessed using flow cytometry. (B, C) Statistical results of Her2 expression intensity of HiTA-CAR-T cells. (D) Quantification of supernatant IL-2 and IFN-γ releases from HiTA-CAR-T and untransduced control T cell(n=3, mean±SD is shown, ***p<0.001, ****p<0.0001, analyzed using Student’s t-test). (E) In vitro cytotoxicity of EF1α-CAR and HiTA-CAR-T cells to SKOV3 tumor cells in indicated E/T ratios in normoxic and hypoxic conditions after 48 hours coincubation. (Bar on charts shows mean±SD of technical triplicates. In line charts, the dots mark means of three independent experiments (n=3 donors) and error bars displayed as the mean±SD, *p<0.05, analyzed using two-way ANOVA). ANOVA, analysis of variance; CAR, chimeric antigen receptor; EF1α, eukaryotic elongation factor 1-α; E/T, effector/target; IFN-γ, interferon γ; IL-2, interleukin 2; HiTA, hypoxia-inducible transcription amplification.

