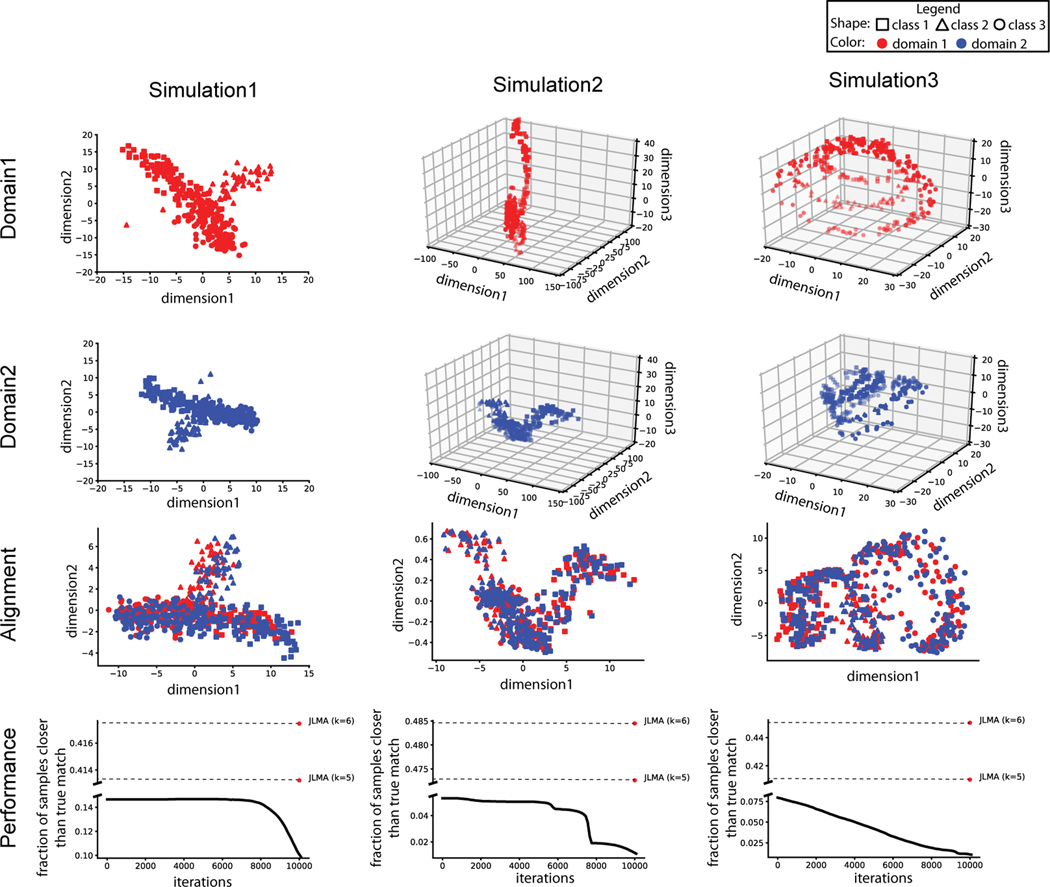
Figure 1. Three simulation experiments.
The first two rows show the MDS projection of the data points in domain 1 and domain 2, separately. The third row shows the projection of the data points in the shared embedding space. The last row plots the fraction of samples closer than the true match as MMD-MA iterates. Points are included from JLMA when k=5 and k=6.

