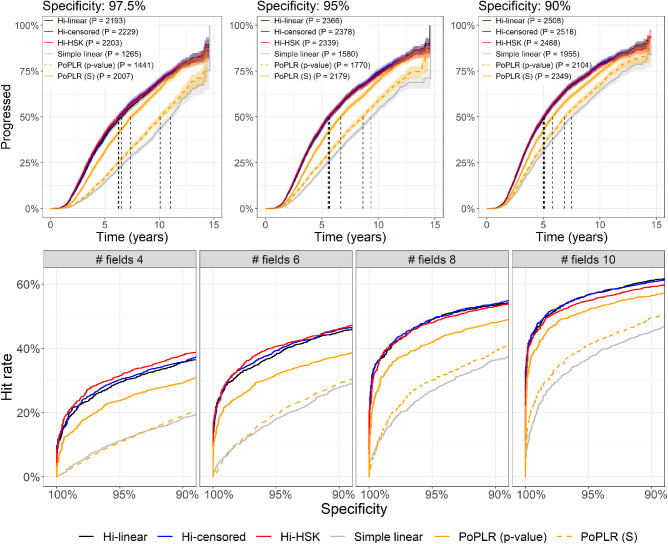
Figure 4.
The top panels present the Kaplan-Meier curves for all tested methods at different specificity levels. P in the legends indicate the number of eyes that progressed with each method. The vertical dashed lines indicated the median time to progression (not color coded). The bottom panels show curves of the hit-rate at different specificity levels for all the progression methods tested with the series truncated at different lengths. Hi = Hierarchical; HSK = Heteroskedastic.

