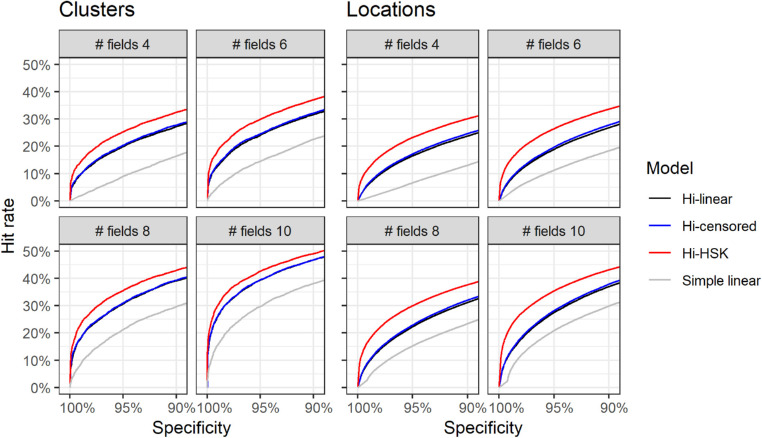
Figure 5.
Curves of hit-rates at different specificities for individual visual field clusters and locations at different lengths of the series. Note that a “hit” is progression in any cluster, or location, and the percentages are calculated over the total number of clusters (N = 20,112) and locations (N = 174,304). Hi = Hierarchical; HSK = Heteroskedastic.

