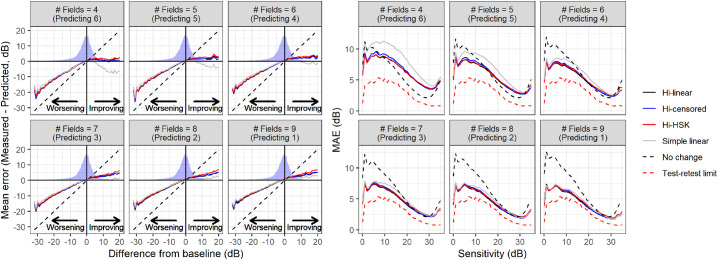
Figure 6.
Average error for pointwise prediction stratified by difference from baseline (left panel) and mean absolute error stratified by baseline VF sensitivity (right panel) for the different hierarchical models and the pointwise linear regression. The density profile in the left panels represent the actual distribution of differences observed in the data. The diagonal dashed line represents the error resulting from predicting no change. Hi = Hierarchical; HSK = Heteroskedastic.

