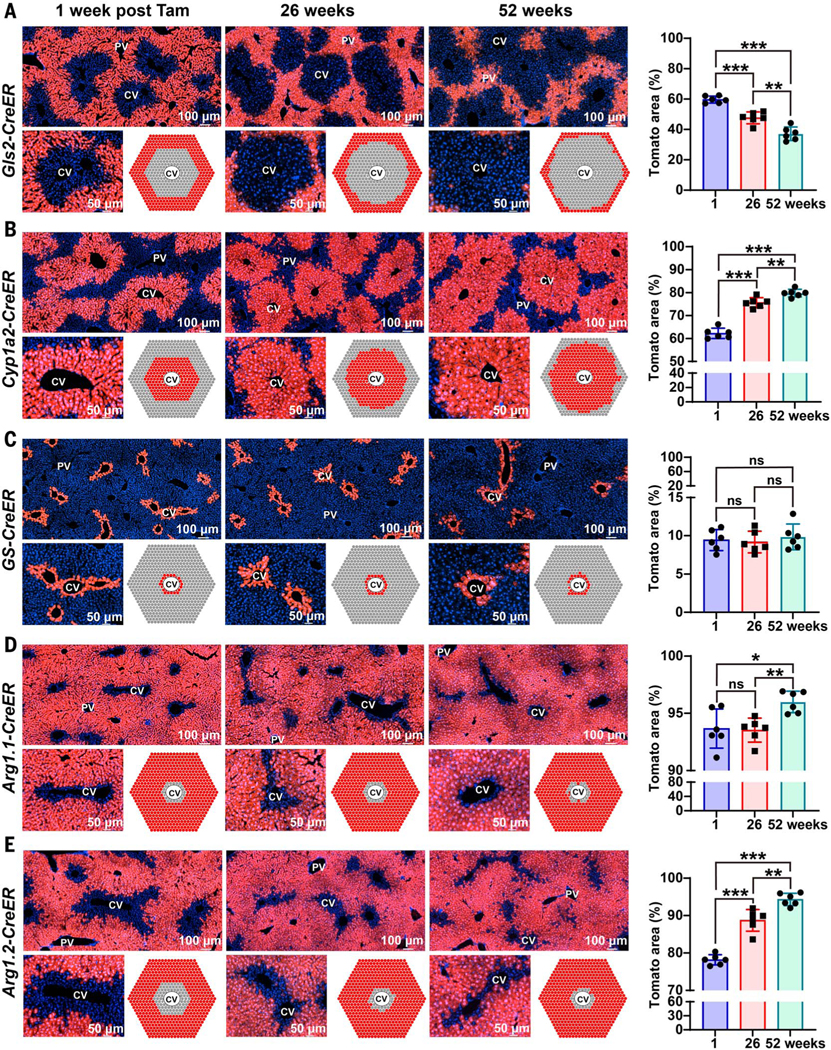
Fig. 2. Zone 1 and zone 3 compartments contract during normal homeostasis.
(A) For each of the lineage tracing experiments in this figure, we measured the proportion of total lobular area covered by Tomato as a proxy measure for hepatocyte repopulation (quantified on the right). Over 6 and 12 months, the percent area labeled by Gls2CreER decreased. (B) Over 6 and 12 months, the percent area labeled by Cyp1a2-CreER increased. (C) Over 6 and 12 months, the percent area labeled by GS-CreER did not change. (D) Over 6 months, the percent area labeled by Arg1.1CreER did not change, but after 12 months, the percent area increased. (E) Over 6 and 12 months, the percent area labeled by Arg1.2-CreER increased. *P < 0.05; **P < 0.01; ***P < 0.001; ns, not significant. Error bars indicate standard deviation (SD).

