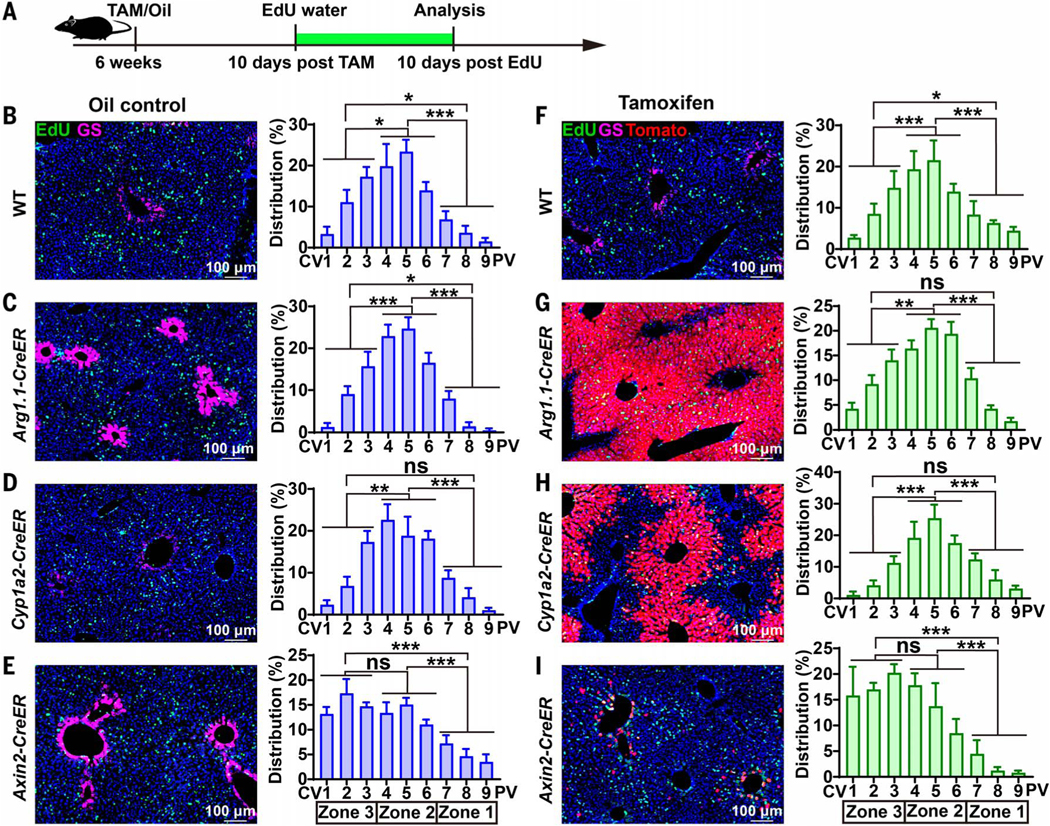
Fig. 3. EdU labeling of wild-type and CreER strains during homeostasis.
(A) Schema for tamoxifen (TAM) administration followed by 10 days of EdU incorporation. (B) EdU florescence images for the detection of proliferating cells (left) and the quantification of spatial distribution of EdU-positive cells (right) from wild-type mice without CreER (n = 6 mice, three images from each were quantified). Distribution (%) of EdU represents the number of EdU-positive cells within a zonal layer divided by the total number of EdU-positive cells in all zones. See methods for positional quantification methods. All images are 7 × 105 μm2. (C) The same EdU analysis in Arg1.1-CreER;tdTomato mice (n = 7 mice, three images from each).(D) EdU analysis in Cyp1a2-CreER;tdTomato mice (n = 5 mice, three images from each). (E) EdU analysis in Axin2-CreER;tdTomato mice (n = 5 mice, three images from each). (F to I) The analysis from (B) to (E) was repeated after tamoxifen administration (n = 8, 9, 8, and 9 mice, respectively). Three images from each mouse were analyzed. *P < 0.05; **P < 0.01; ***P < 0.001. Error bars indicate standard error (SEM).

