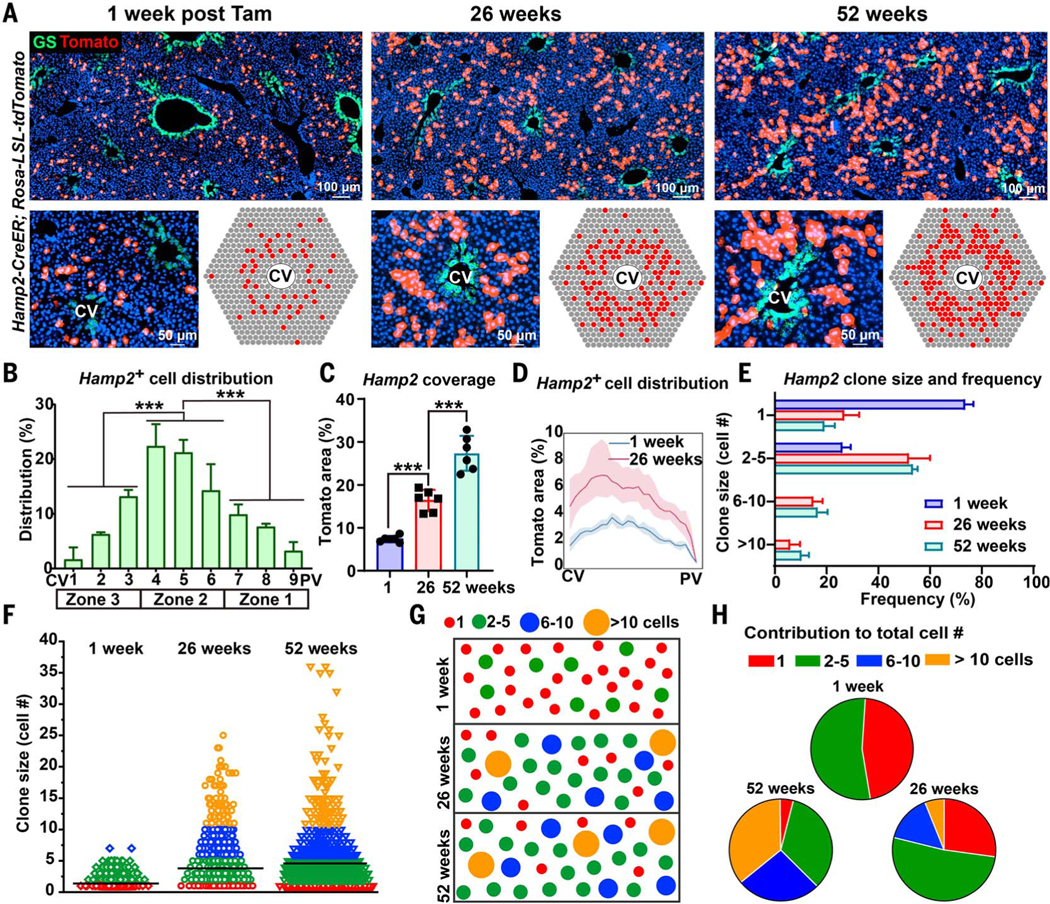
Fig. 4. Zone 2 hepatocytes repopulate the liver during normal homeostasis.
(A) Hamp2CreER Tomato labeling at 1, 26, and 52 weeks. Endogenous GS immunofluorescence shown in green marks the CV region. Cartoon depicting the pattern of Tomato labeling in Hamp2-CreER livers over time (bottom right).(B) Manual measurements of Hamp2-CreER–labeled Tomatopositive cells as a function of position along the CV-to-PV axis. (C) The percent area labeled by Hamp2-CreER at 1, 26, and 52 weeks after tamoxifen administration. (D) Image analysis of Hamp2-labeled area at 1 and 26 weeks after tamoxifen administration. (E) Labeled clone size frequency in Hamp2-CreER livers at 1, 26, and 52 weeks after tamoxifen administration. (F) Individual clone size distribution in Hamp2-CreER livers at 1, 26, and 52 weeks after tamoxifen administration. The mean clone size (horizontal black line) increased from 1.38 ± 0.37 to 3.81 ± 0.35 to 4.74 ± 0.48 cells at 1, 26, and 52 weeks, respectively (mean ± SD). (G) Statistically representative cartoon of clone size changes over time. (H) Pie chart showing how different-sized clones contributed to the total number of labeled cells. ***P < 0.001. Error bars indicate SD for all panels except (B), where SEM is used.

