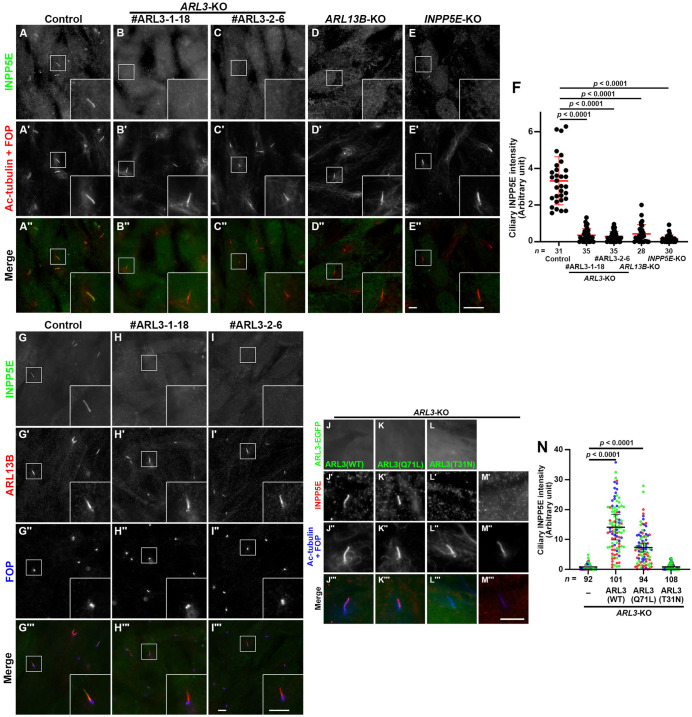
Fig. 2.
Delocalization of INPP5E from the ciliary membrane in ARL3-KO, ARL13B-KO, and INPP5E-KO cells. Control RPE1 cells (A), the ARL3-KO cell lines #ARL3-1-18 (B) and #ARL3-2-6 (C), the ARL13B-KO cell line #ARL13B-1-2 (D), and the INPP5E-KO cell line #INPP5E-2-2 (E) were serum-starved for 24 h to induce ciliogenesis, and immunostained for INPP5E (A–E) and Ac-tubulin+FOP (A′–E′). Insets show 2.5-fold magnified images of the boxed regions. (F) Relative ciliary staining intensities of INPP5E in control, ARL3-KO, ARL13B-KO, and INPP5E-KO cells were estimated and expressed as scatter plots. The total number of cells analyzed (n) are indicated. Horizontal lines are means, and error bars indicate the SD. Statistical significances were calculated using one-way ANOVA followed by the Dunnett's multiple comparison test. (G–I) Control RPE1 cells (G) and the ARL3-KO cell lines #ARL3-1-18 (H) and #ARL3-2-6 (I) were serum-starved for 24 h and triply immunostained for INPP5E, ARL13B, and FOP. Insets show 2.5-fold magnified images of the boxed regions. (J–M) ARL3-KO cells (#ARL3-1-18), which stably express EGFP-fused ARL3(WT) (J), ARL3(Q71L) (K), or ARL3(T31N) (L), were serum starved for 24 h and triply immunostained for GFP, INPP5E, and Ac-tubulin+FOP. Scale bars, 5 µm. (N) Relative ciliary staining intensities of INPP5E in individual cells shown in (J′)–(M′) were estimated and expressed as scatter plots. Different colored dots represent three independent experiments; the horizontal lines indicate the means, and error bars are the SDs. Statistical significances were calculated using one-way ANOVA followed by the Dunnett's multiple comparison test.

