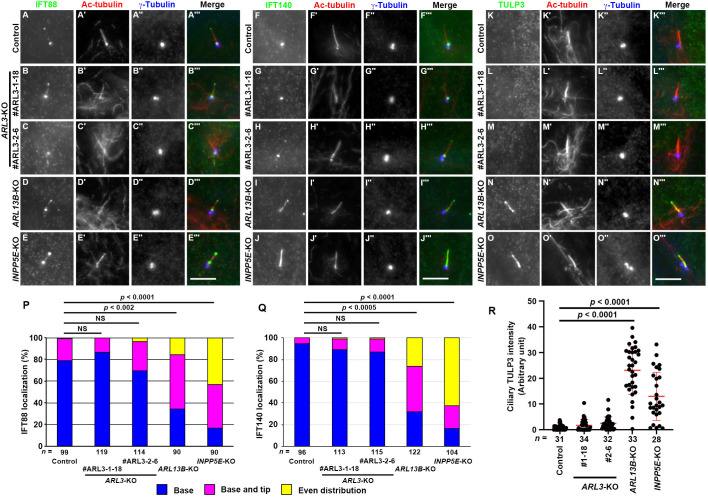
Fig. 3.
Localizations of IFT-B and IFT-A proteins are differentially affected in ARL3-KO, ARL13B-KO, and INPP5E-KO cells. (A–O) Control RPE1 cells (A, F, K), the ARL3-KO cell lines #ARL3-1-18 (B, G, L) and #ARL3-2-6 (C, H, M), the ARL13B-KO cell line #ARL13B-1-2 (D, I, N), and the INPP5E-KO cell line #INPP5E-2-2 (E, J, O) were serum-starved for 24 h and triply immunostained with antibodies against IFT88 (A–E), IFT140 (F–J), or TULP3 (K–O), Ac-tubulin (A′–O′), and γ-tubulin (A″–O″). Scale bars, 5 µm. (P, Q) Localization of IFT88 (P) and IFT140 (Q) in control, ARL3-KO, ARL13B-KO, and INPP5E-KO cells was classified as ‘localization to ciliary base’, ‘localization to ciliary base and tip’, and ‘even distribution throughout cilia’, and the number of cells in each category was counted. The percentages of these populations are expressed as stacked bar graphs. Values are shown as the means of three independent experiments, and the total number of cells analyzed (n) are indicated. In each set of experiments, 26 to 47 cells (P) and 30 to 46 cells (Q) were analyzed. Statistical significances were calculated for the ‘base’ category using one-way ANOVA followed by the Tukey–Kramer test. (R) Relative ciliary staining intensities of TULP3 in control, ARL3-KO, ARL13B-KO, and INPP5E-KO cells were estimated and expressed as scatter plots. The horizontal lines indicate the means, and the error bars are the SDs. Statistical significances were calculated using one-way ANOVA followed by the Dunnett's multiple comparison test.

