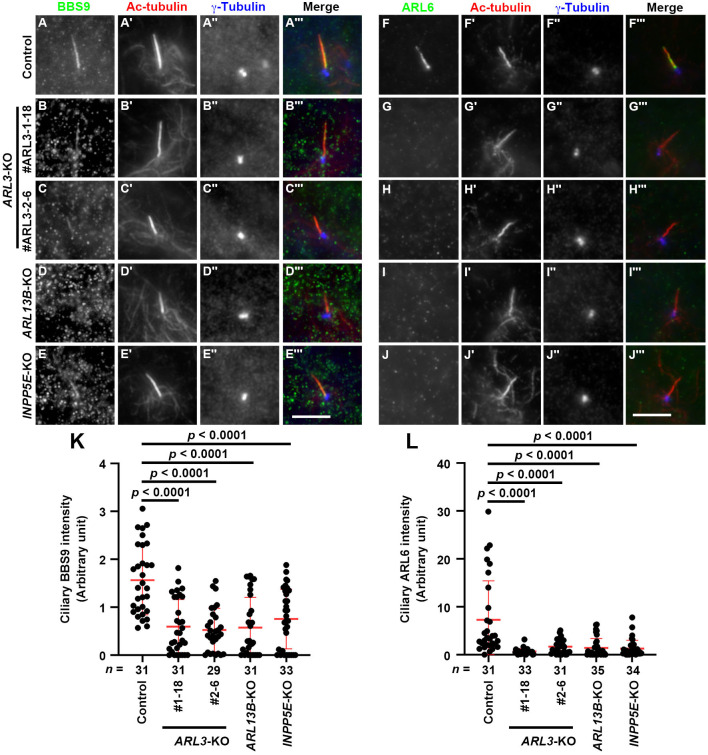
Fig. 5.
Absence of the BBSome within cilia of ARL3-KO, ARL13B-KO, and INPP5E-KO cells. Control RPE1 cells (A, F), the ARL3-KO cell lines #ARL3-1-18 (B, G) and #ARL3-2-6 (C, H), the ARL13B-KO cell line #ARL13B-1-2 (D, I), and the INPP5E-KO cell line #INPP5E-2-2 (E, J) were serum-starved for 24 h, and triply immunostained for either BBS9 (A–E) or ARL6 (F–J), Ac-tubulin (A′–J′), and γ-tubulin (A″–J″). Scale bars, 5 µm. (K, L) Relative ciliary staining intensities of BBS9 (K) and ARL6 (L) in control, ARL3-KO, ARL13B-KO, and INPP5E-KO cells were estimated and expressed as scatter plots. Horizontal lines indicate the means, and error bars are the SDs. Statistical significances were calculated using one-way ANOVA followed by the Dunnett's multiple comparison test.

