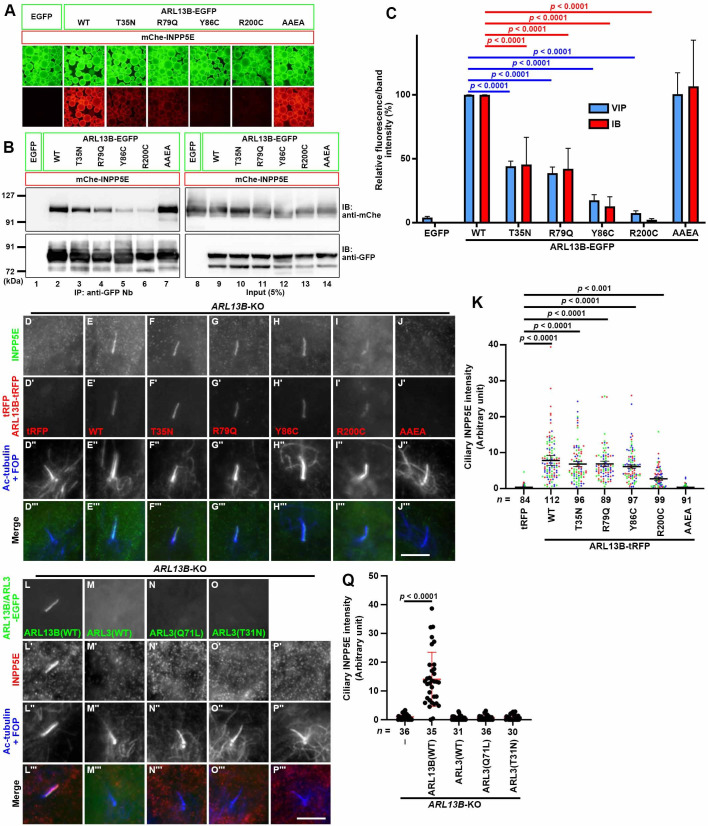
Fig. 6.
Ciliary localization of INPP5E correlates with its binding to ARL13B. (A, B) Lysates of cells coexpressing an EGFP-fused ARL13B construct as indicated and mChe-INPP5E were subjected to the VIP assay using GST–anti-GFP Nb (A), followed by immunoblotting analysis using anti-mChe and anti-GFP antibodies (B). (C) The fluorescence intensities of (A) and the band intensities (B) of mChe-INPP5E were measured, and the relative intensities are represented as bar graphs with the intensity in HEK293T cells expressing ARL13B(WT)-EGFP set as 100%. Values are shown as the means±SD of three independent experiments. Statistical significances among multiple cell lines were calculated using one-way ANOVA followed by the Dunnett's multiple comparison test. (D–J) ARL13B-KO cells (#ARL13B-1-2) expressing the tRFP-fused ARL13B constructs indicated were serum-starved for 24 h and immunostained for INPP5E (D–J) and Ac-tubulin+FOP (D″–J″). (K) The relative ciliary staining intensities of INPP5E in ARL13B-KO cells stably expressing tRFP (D) or the tRFP-fused ARL13B constructs indicated (E–J) are represented as scatter plots. Different colored dots represent three independent experiments, horizontal lines indicate the means, and error bars are the SDs. Statistical significances among multiple cell lines were calculated using one-way ANOVA followed by the Dunnett's multiple comparison test. (L–P) ARL13B-KO cells (#ARL13B-1-2), which stably express EGFP-fused ARL13B(WT) (L), ARL3(WT) (M), ARL3(Q71L) (N), or ARL3(T31N) (O) were serum starved for 24 h and triply immunostained for GFP, INPP5E, and Ac-tubulin+FOP. (Q) Relative ciliary staining intensities of INPP5E in individual cells shown in (L′)–(P′) were estimated and expressed as scatter plots. The horizontal lines indicate the means, and the error bars indicate the SDs. Statistical significances were calculated using one-way ANOVA followed by the Dunnett's multiple comparison test.

