Figure 1.

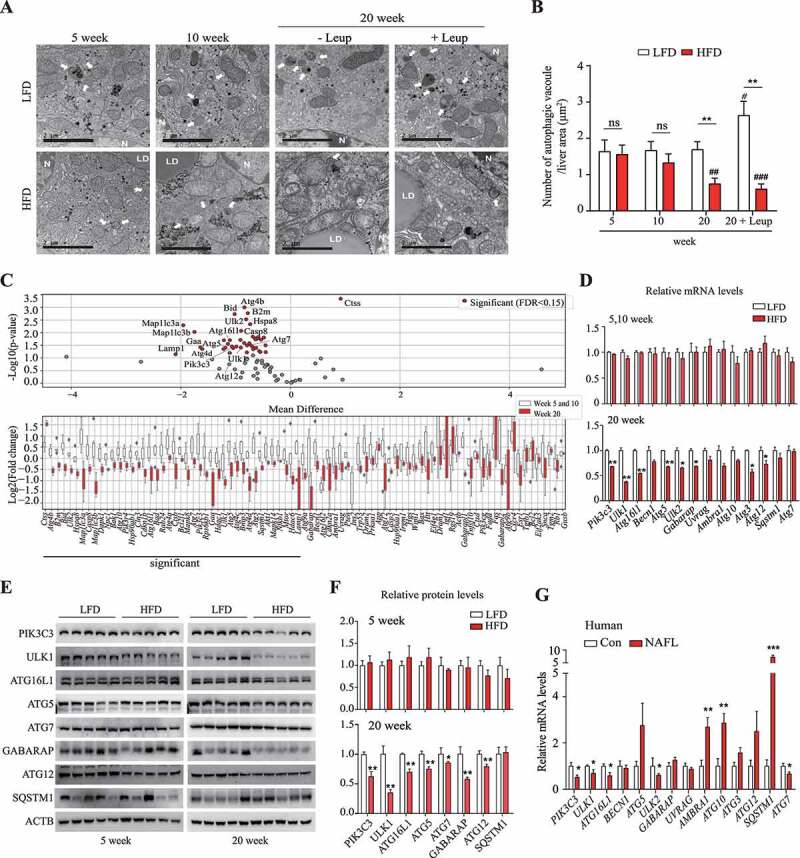
Autophagic activity was decreased in the livers of long-term-HFD-fed mice. (A) Representative TEM images of autophagic vacuoles in the liver. Scale bar: 2 μm (B) The number of autophagic vacuoles per μm2 of liver area was counted. (C) The expression of autophagy-related genes was analyzed using PCR array. The RNA samples from liver tissues were pooled by group, and PCR arrays were analyzed in triplicate. Autophagy-related genes selected using the criterion having FDR < 0.15 are labeled and colored in red. Bar plots of expression levels for the autophagy genes, with dots representing data points. (D) The expression of genes found to be downregulated in the PCR array analysis was validated using qRT-PCR. (E) Protein levels for selected autophagy-related genes in the livers of 5-week or 20-week HFD- or LFD-fed mice. (F) Abundance of the protein products of selected autophagy-related genes in HFD groups relative to that in LFD groups (density ratio of protein:ACTB). (G) Autophagy-related gene mRNA levels in fatty liver (n = 6) and adjacent normal liver tissue samples (n = 5) from hepatocellular carcinoma patients were analyzed. Values represent mean ± SEM (n = 10). * p < 0.05; ** p < 0.01; *** p < 0.001, compared to LFD or normal liver tissues (Con, control). Ambra1: autophagy and beclin 1 regulator 1; ATG: autophagy-related; GABARAP: gamma-aminobutyric acid receptor associated protein; HFD: high-fat diet; LFD: low-fat diet; Leup: leupeptin; mRNA: messenger RNA; NAFLD: nonalcoholic fatty liver disease; ns: not significant; PCR: polymerase chain reaction; PIK3C3: phosphatidylinositol 3-kinase catalytic subunit type 3; qRT-PCR: quantitative reverse transcription PCR; RNA: ribonucleic acid; SEM: standard error of mean; SQSTM1/p62: sequestosome 1; TEM, transmission electron microscopy; ULK1: unc-51 like kinase 1; Uvrag: UV radiation resistance associated gene
